-
Young et al. (2022), Figure 2
Hidden talents in context: Cognitive performance with abstract versus ecological stimuli among adversity-exposed youth.
 ggplot2
- Caption
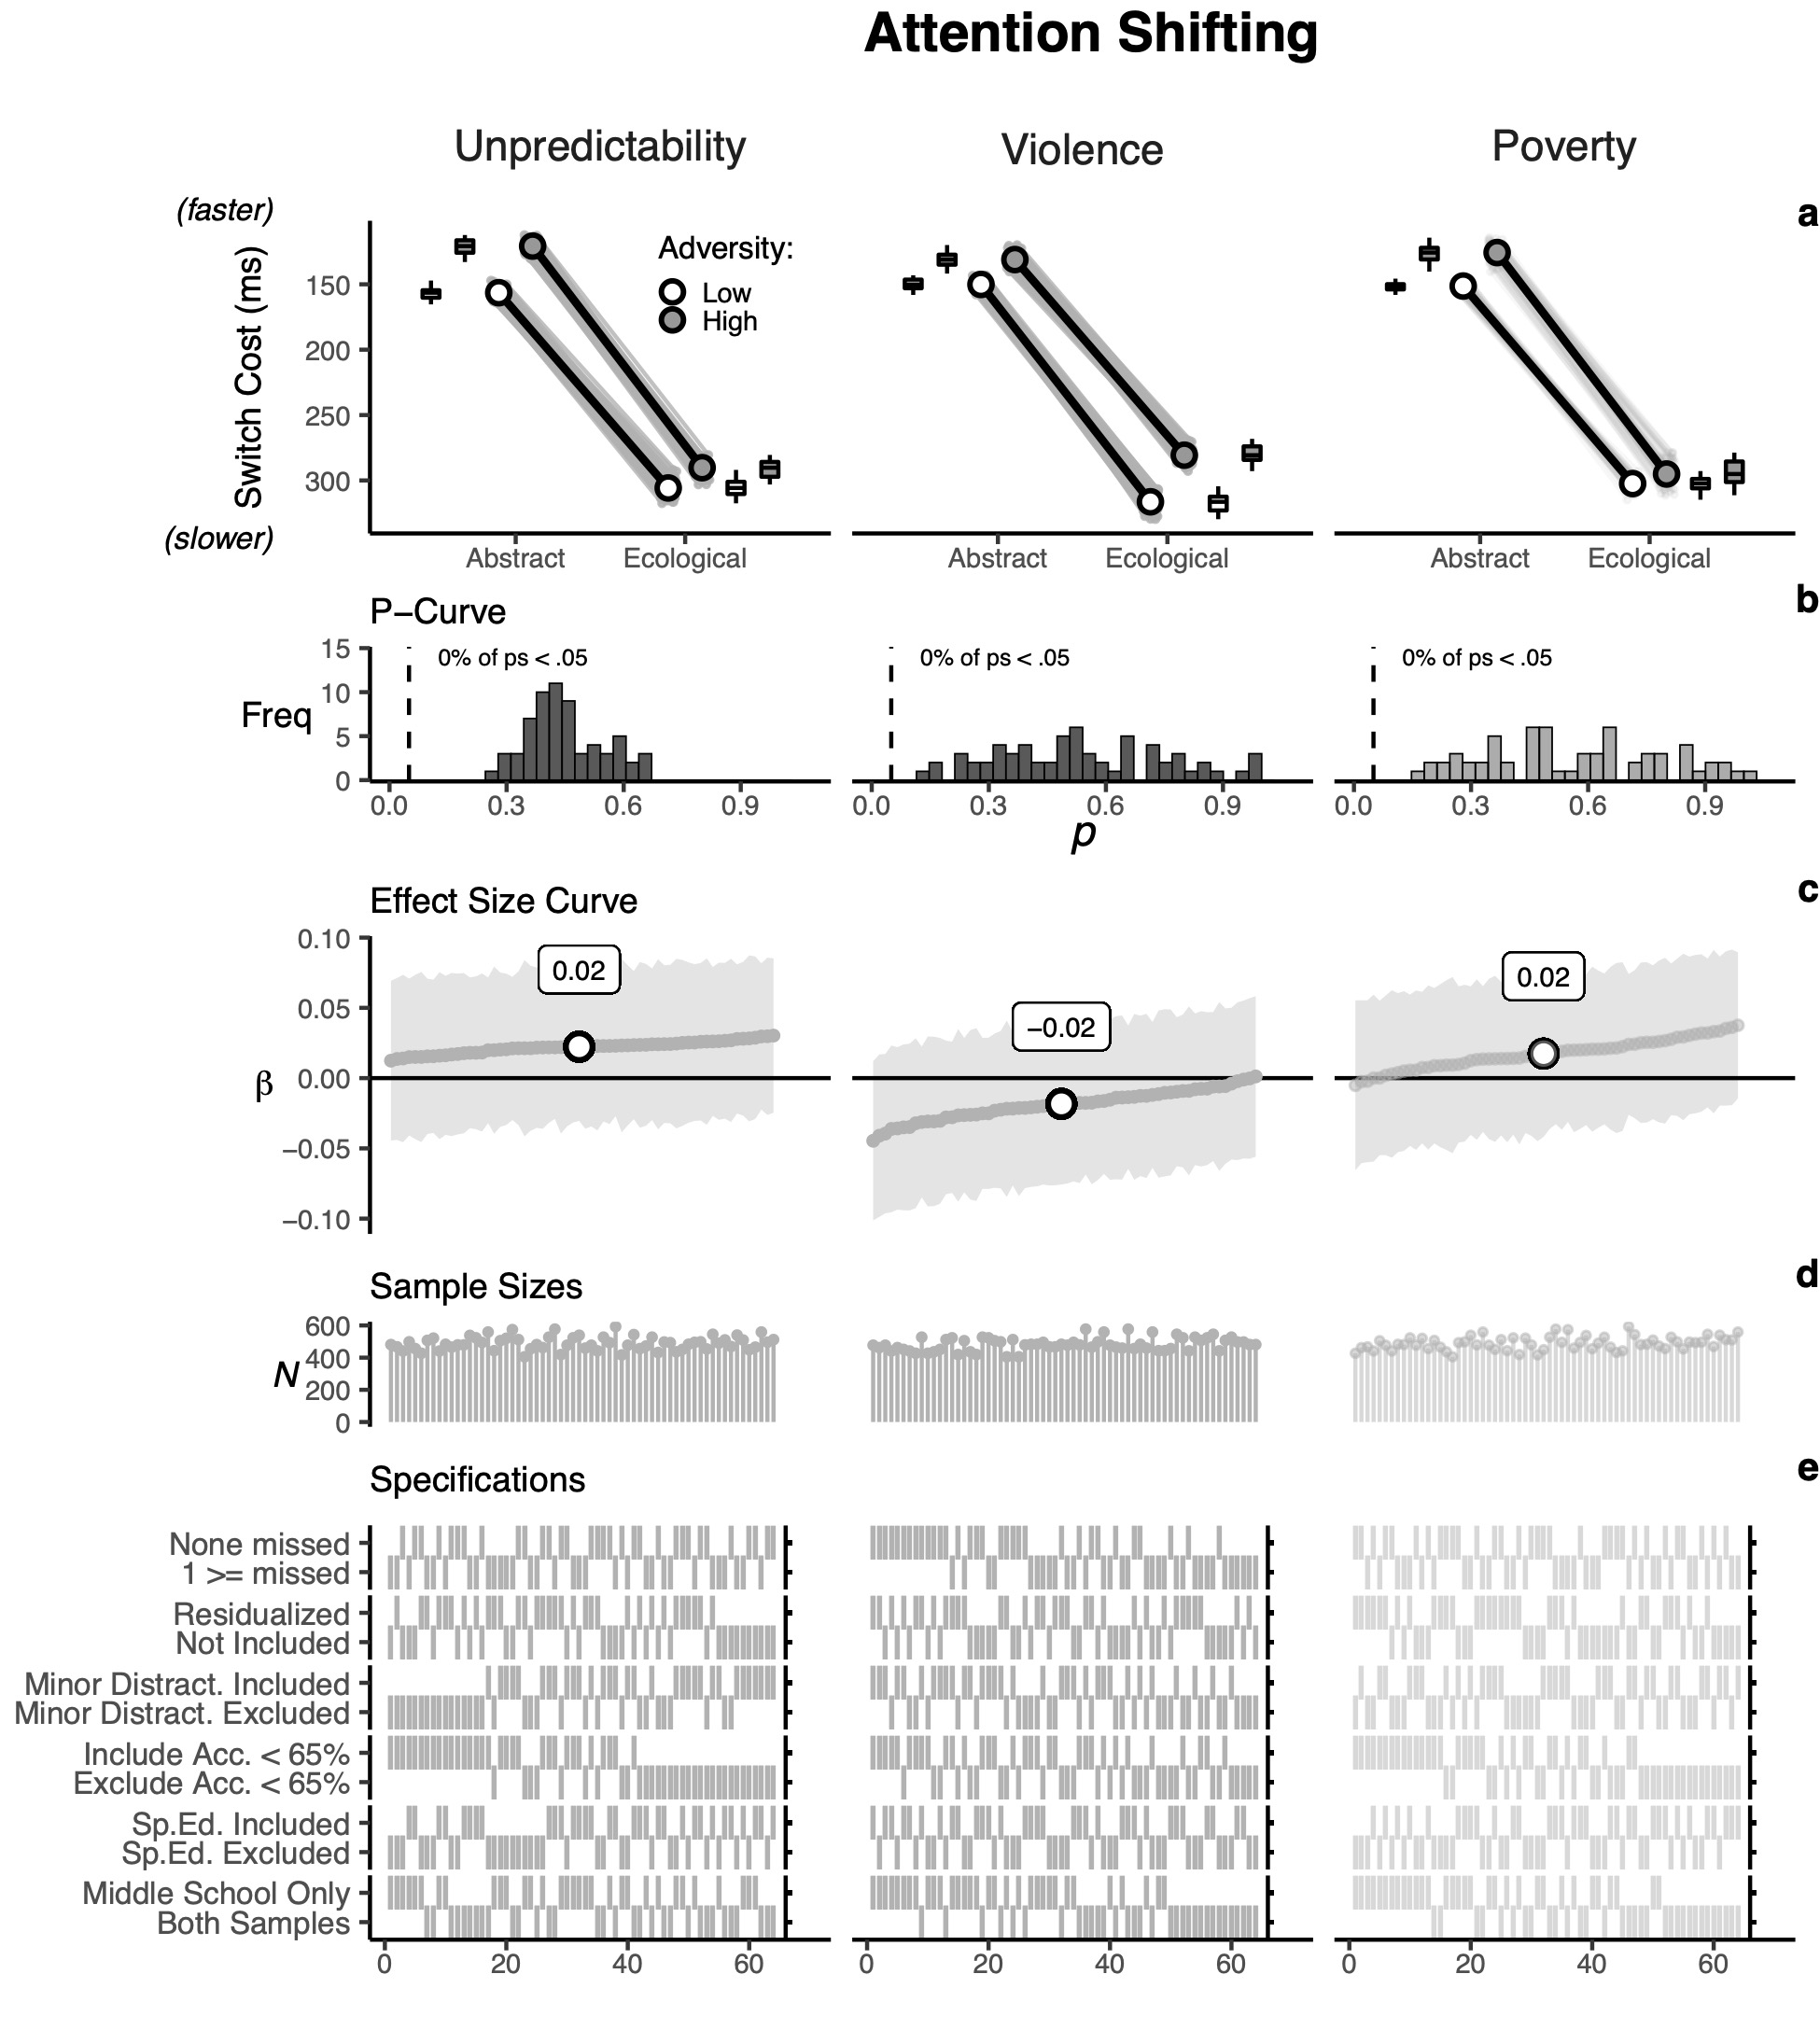
Figure 2. Visualization of multiverse attention-shifting results. Unpredictability and violence exposure multiverse analyses were confirmatory and poverty analyses were exploratory. (a) visualizes the multiverse task version × adversity interaction on abstract and ecological task versions across high (+1 SD) and low (−1 SD) adversity exposure (y-axis was reversed so that higher values = faster shifting), (b) plots p-curves associated with each interaction term, (c) plots sorted interaction β-coefficients across each arbitrary decision, (d) plots the sample sizes for each effect, and (e) is a specification grid indicating the data processing decisions associated with each effect
Young et al. (2022), Figure 3
Hidden talents in context: Cognitive performance with abstract versus ecological stimuli among adversity-exposed youth.
 ggplot2
- Caption
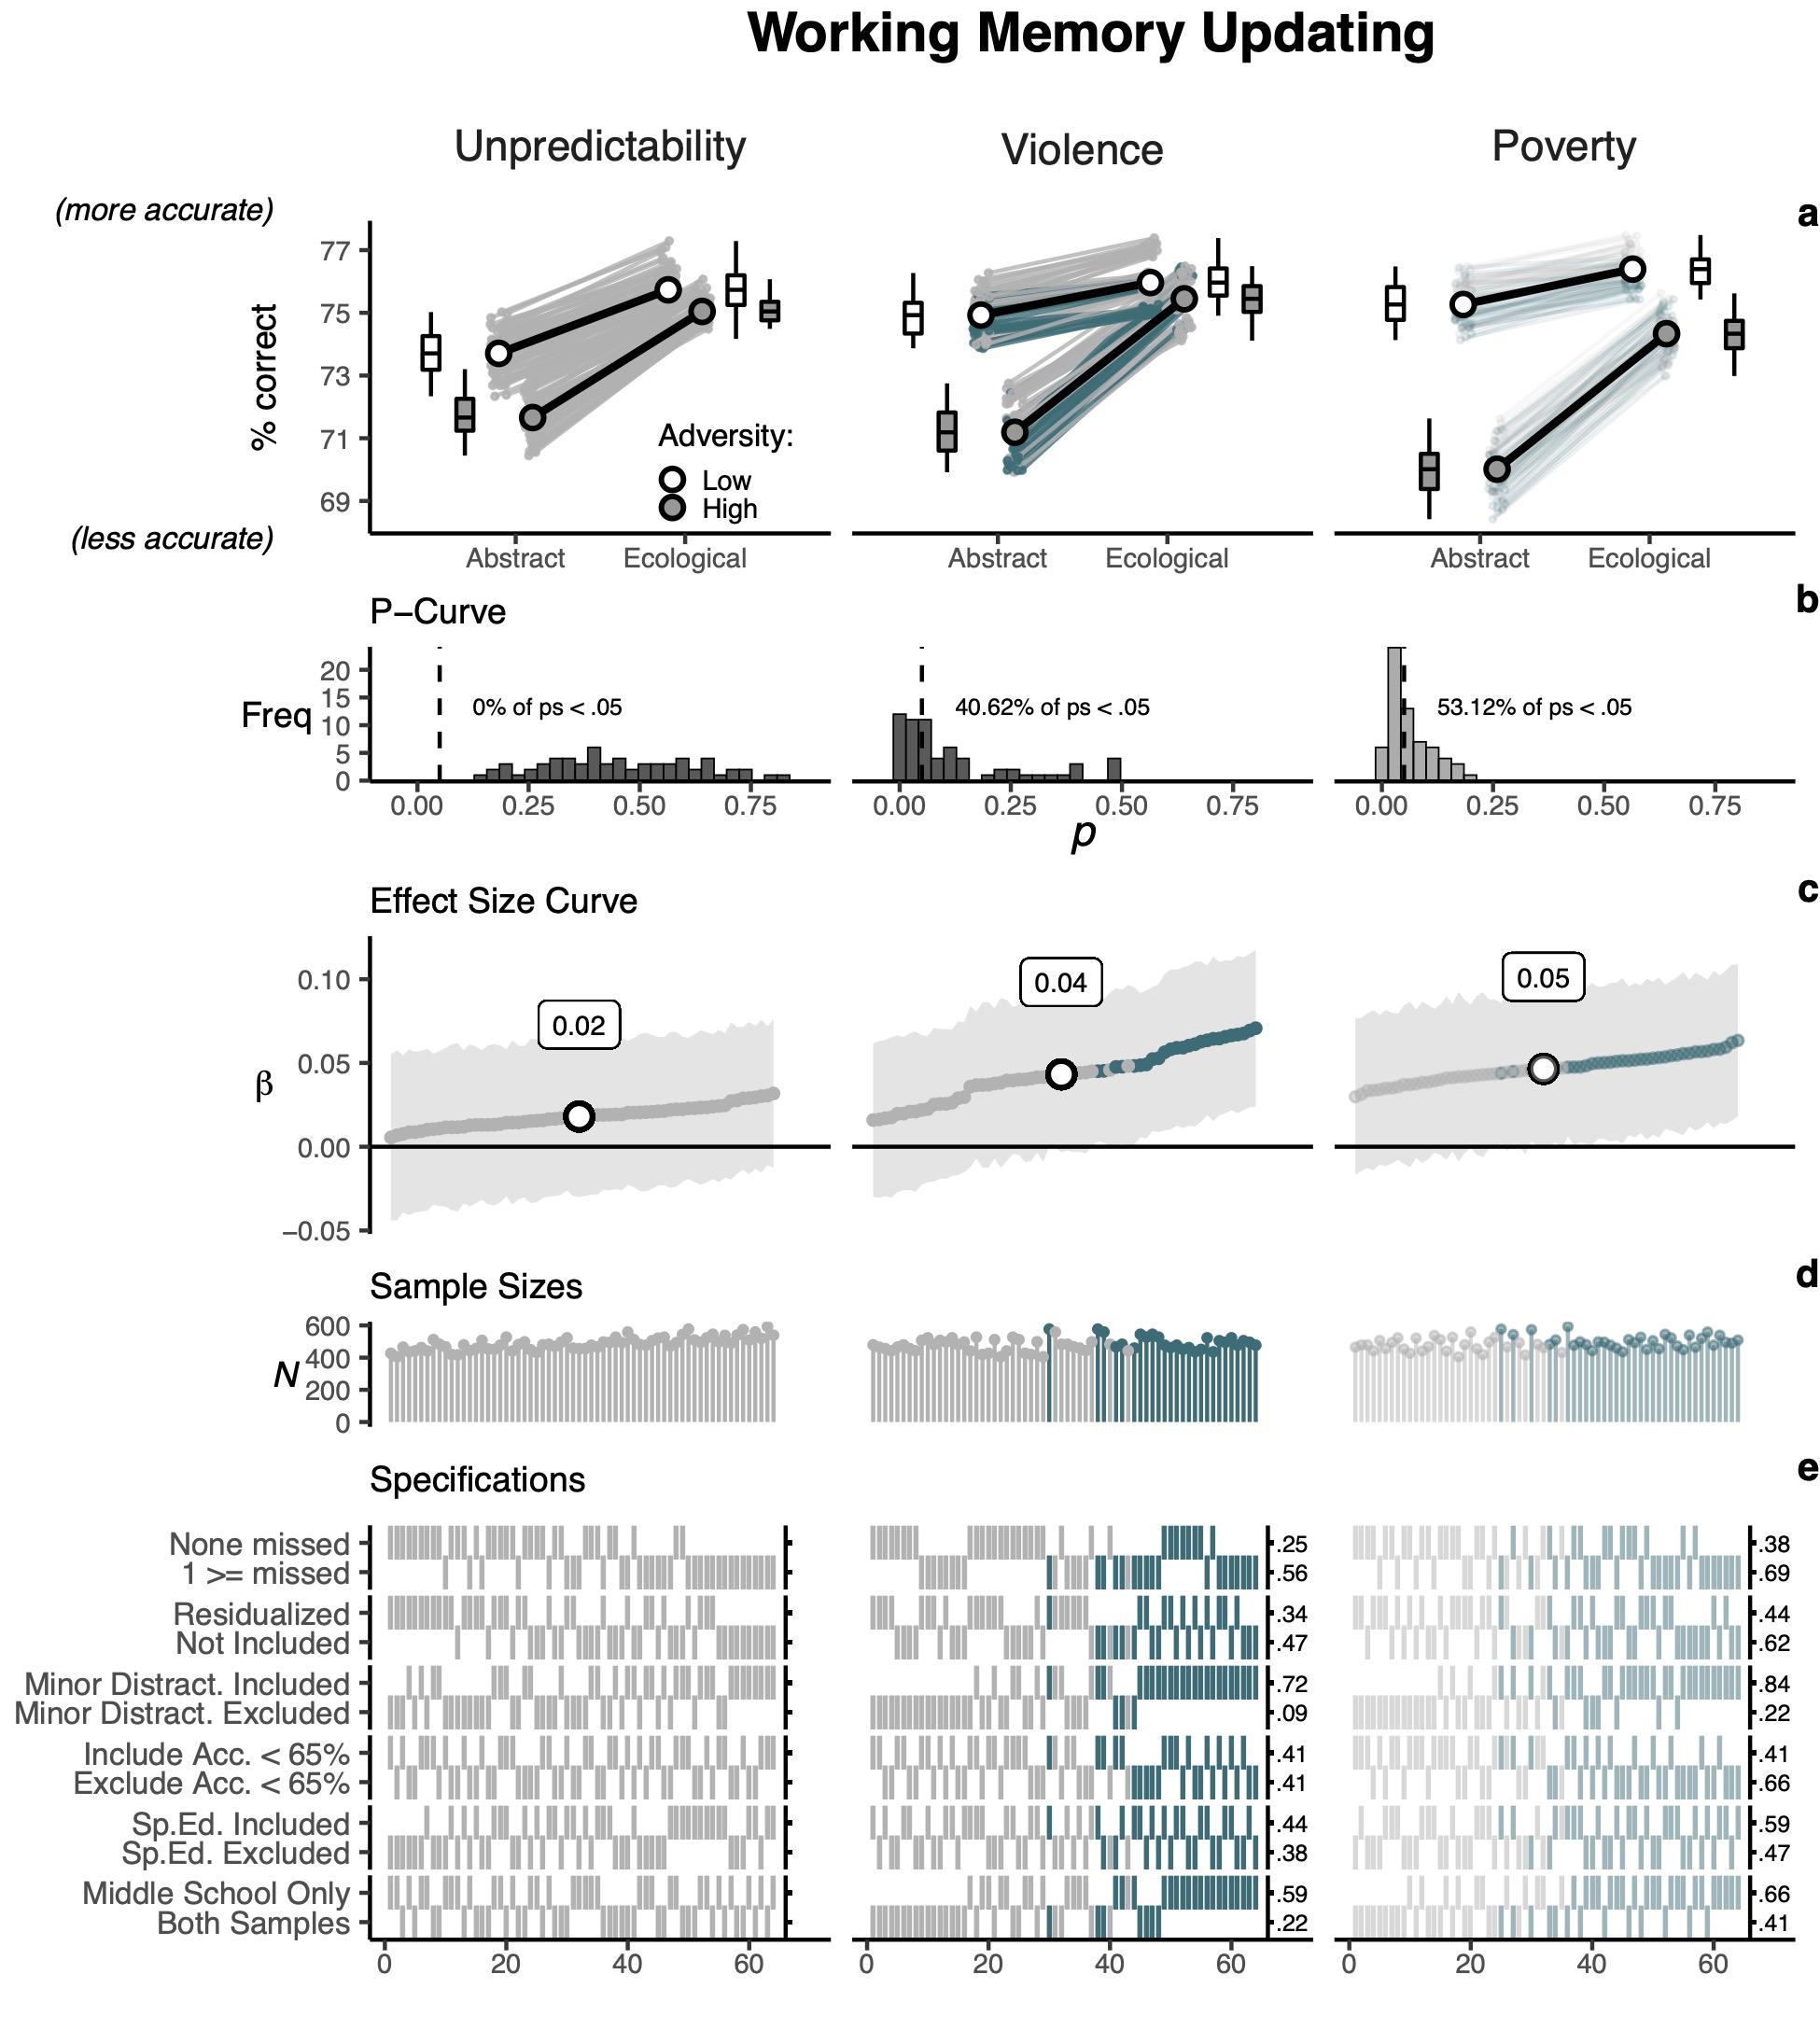
Figure 3. Visualization of multiverse working memory updating results. Unpredictability and Violence exposure multiverse analyses were confirmatory and poverty analyses were exploratory. (a) visualizes the multiverse task version × adversity interaction on abstract and ecological task versions across high (+1 SD) and low (−1 SD) adversity exposure, (b) plots p-curves associated with each interaction term, (c) plots sorted interaction β-coefficients across each arbitrary decision, (d) plots the sample sizes for each effect, and (e) is a specification grid indicating the data processing decisions associated with each effect. Proportions of each arbitrary decision with p-values < .05 are indicated on the right side of each specification grid. Blank proportions indicate proportions = 0. Teal lines and points reflect individual multiverse effect sizes with p-values < .05
Young et al. (2020), Figure 3
Life stress and cortisol reactivity: An exploratory analysis of stress exposure across life on HPA axis functioning.
 ggplot2
- Caption
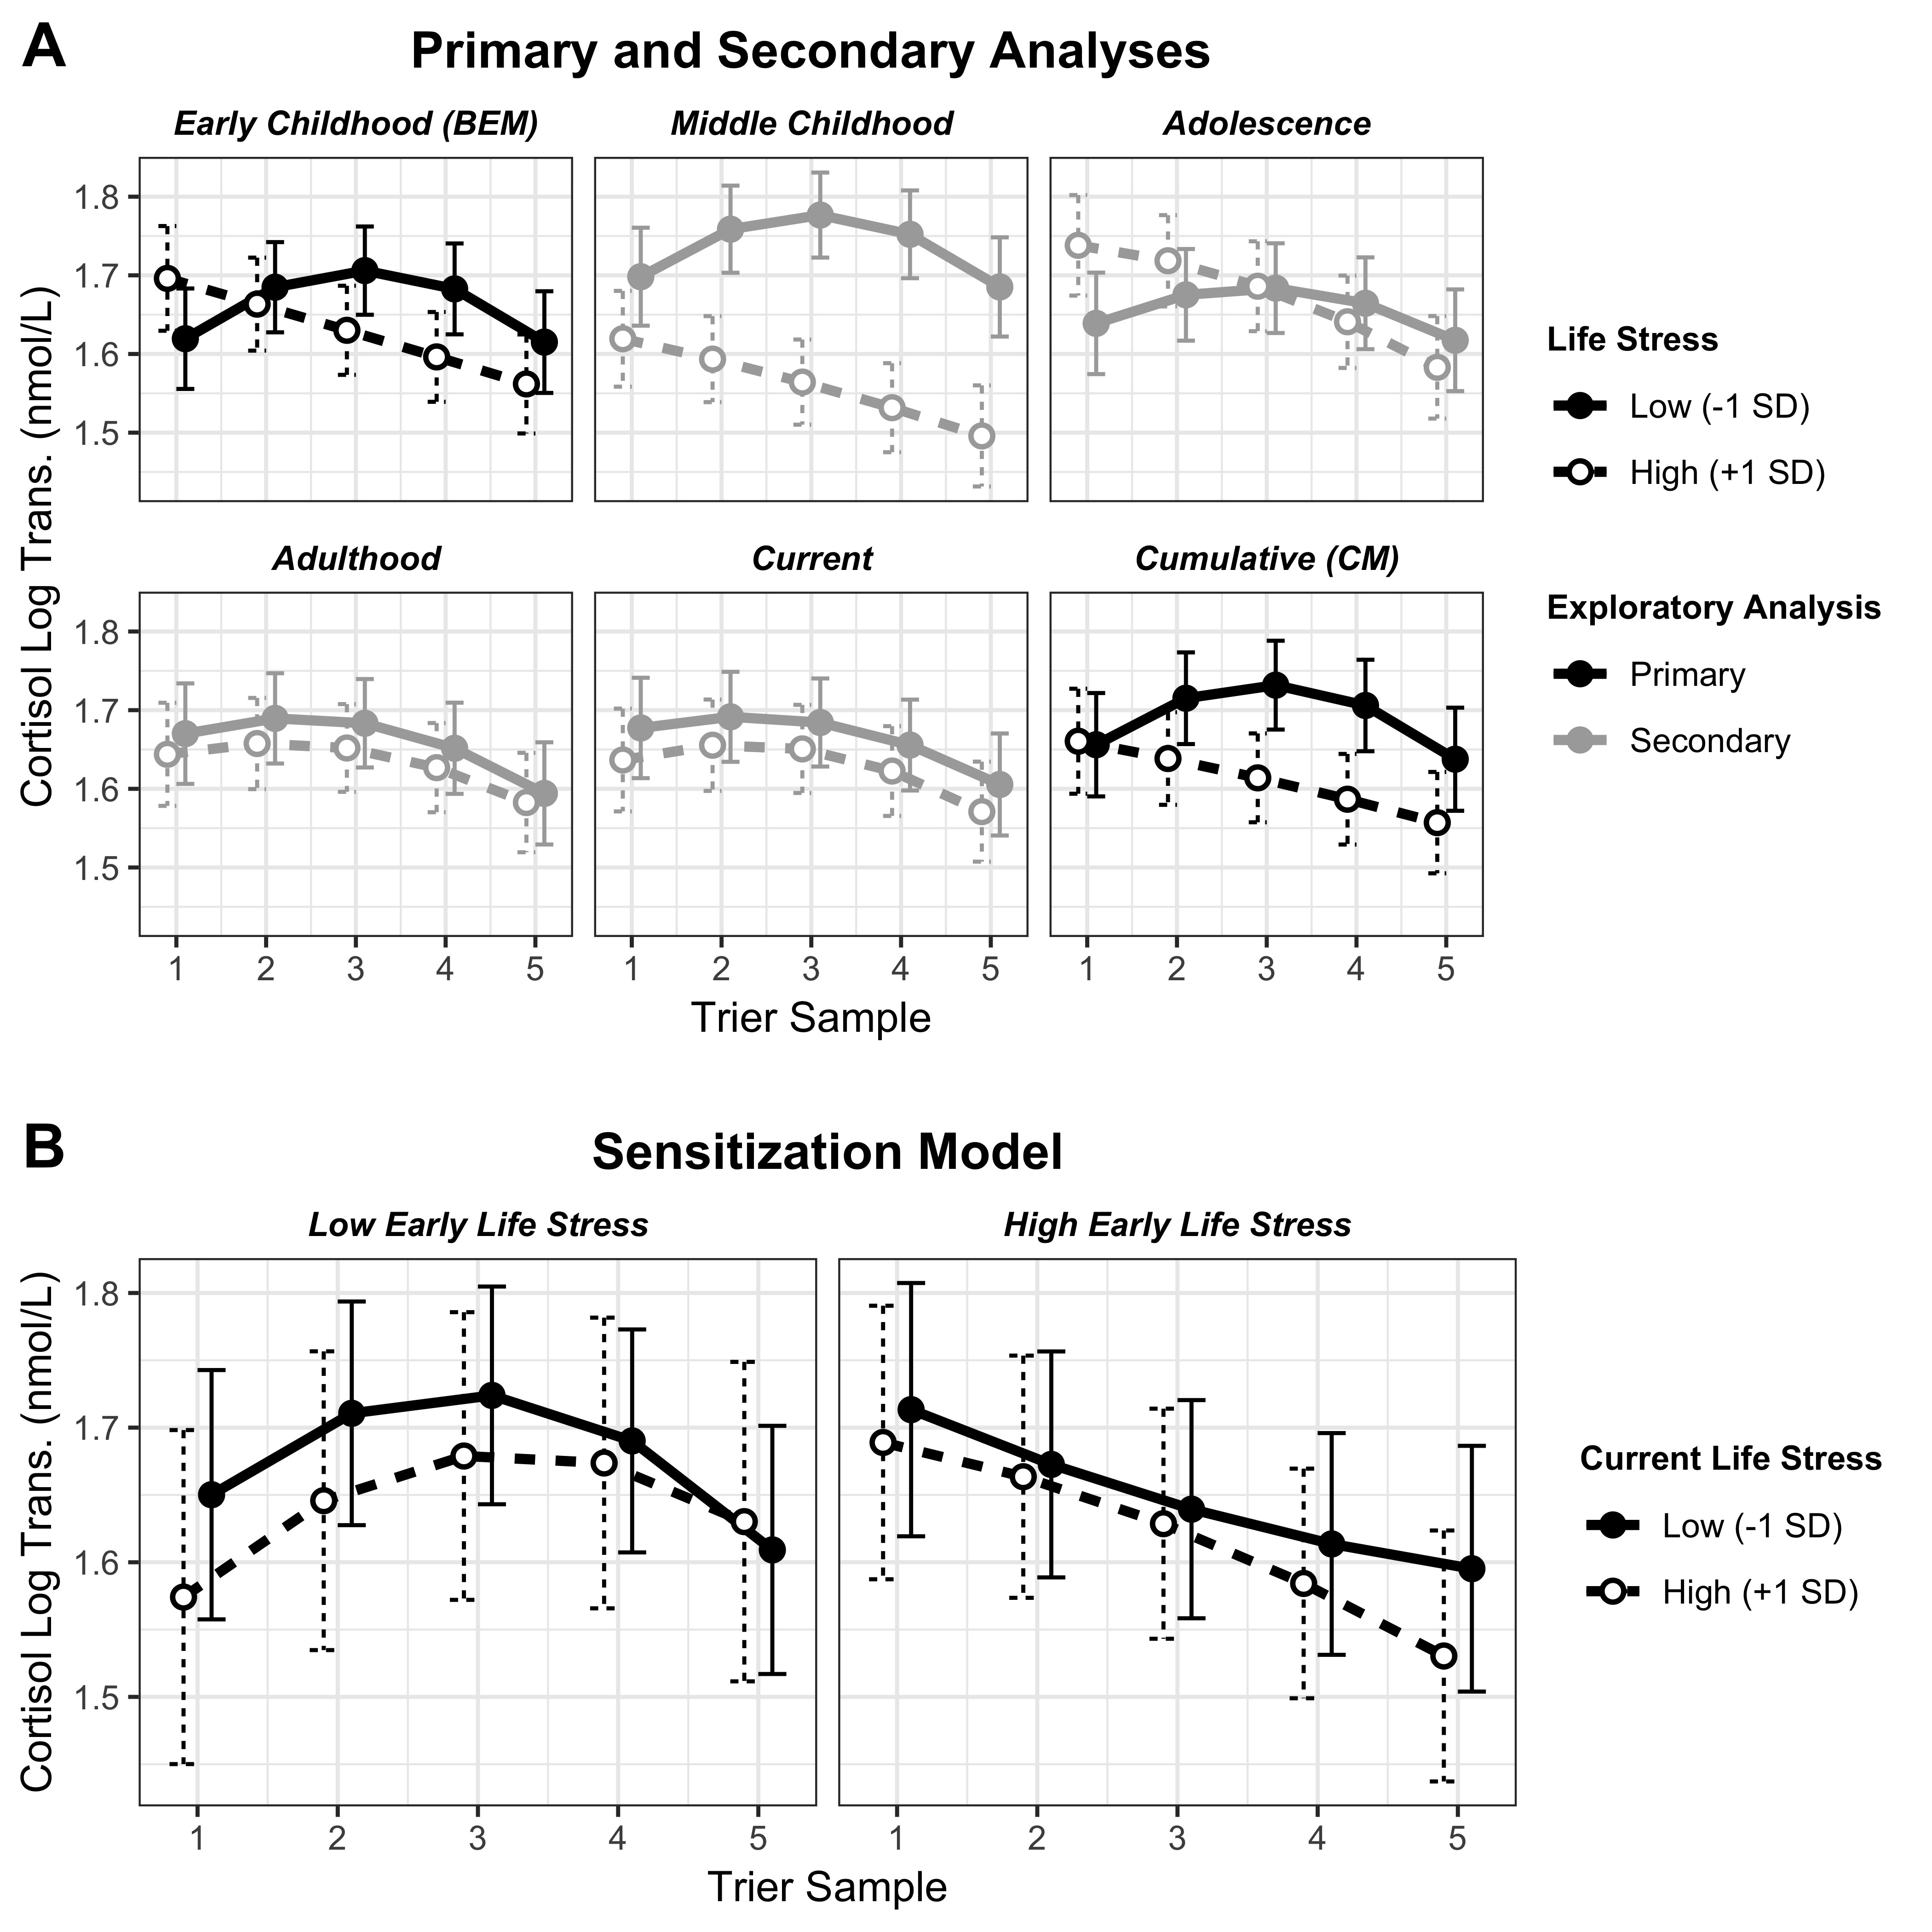
Figure 3. (a) Interaction plots for all effects for each of the models tested in both the primary and secondary analyses. The panels are arranged in chronological order from left to right and top to bottom, starting with early life stress (BEM) and ending with the cumulative life stress effects. The panels with black lines depict the effects from the primary analyses. The panels with light gray lines depict effects from the secondary analyses. The solid points and lines reflect effects for low life stress, and empty points with dotted lines reflect high life stress (the panel titles indicate the life stress period). (b) Visual depiction of the sensitization model. The left panel plots the effect of high versus low current life stress for individuals who were exposed to low levels of early life stress. The right panel plots the effect of high versus low current life stress for individuals who were exposed to high levels of early life stress.
Young et al. (2019), Figure 1
The Dual Impact of Early and Concurrent Life Stress on Adults’ Diurnal Cortisol Patterns: A Prospective Study
 ggplot2
- Caption
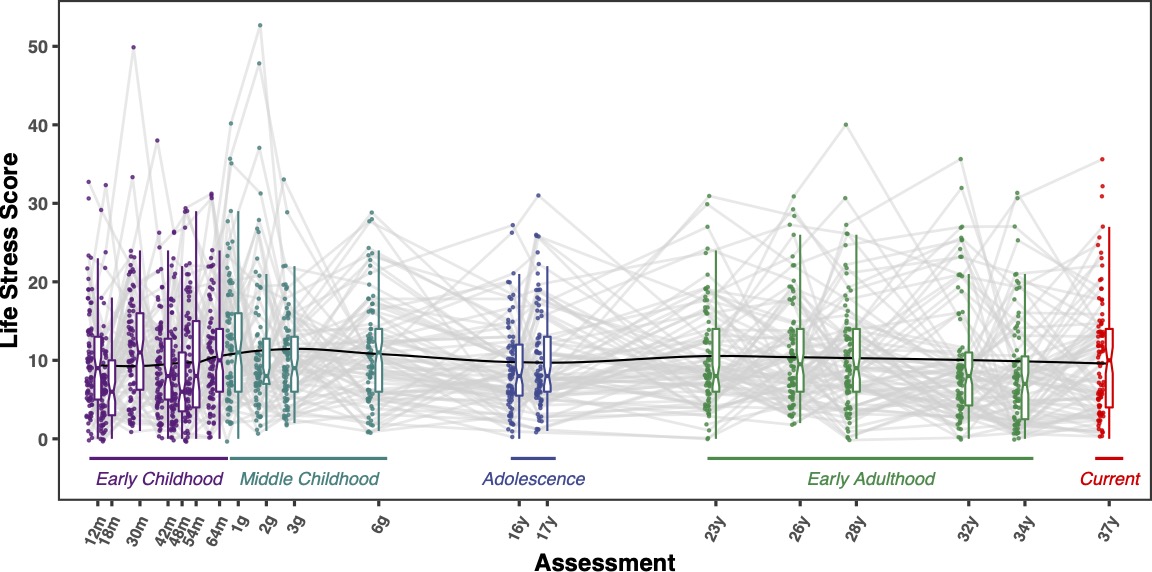
Fig. 1. Life-stress scores as a function of assessment. Box plots of life-stress scores are plotted alongside raw data for each life-stress assessment. Lower and upper hinges of each box plot represent the 25th and 75th percentiles, respectively. The whiskers represent values between each hinge and 1.5 times the interquartile range. Horizontal solid lines within each box plot represent median stress scores. Each gray line shows the trajectory of the scores of an individual participant. The black line represents a smoothed sample average of the trend across all assessments.
Young et al. (2019), Figure 2
The Dual Impact of Early and Concurrent Life Stress on Adults’ Diurnal Cortisol Patterns: A Prospective Study
 ggplot2
- Caption
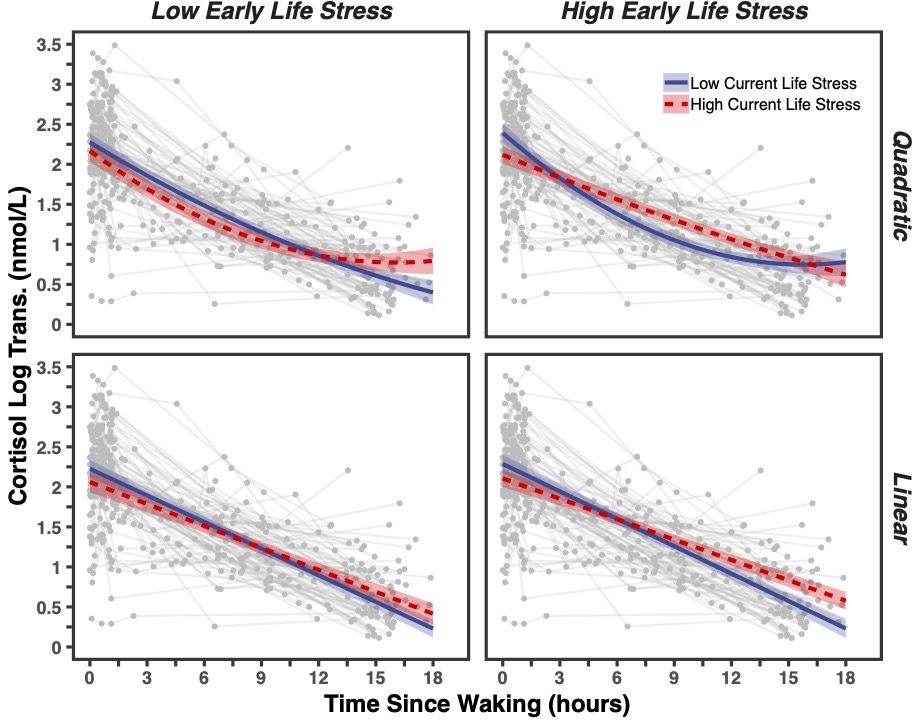
Fig. 2. Log-transformed diurnal cortisol as a function of time since waking. The colored lines show results from the mixed model testing the sensitization model of stress, which predicts that current life stress moderates the effect of early life stress on the diurnal cortisol pattern. The gray points and lines represent the raw data (note that these data are the same across all four panels). The panels in the left column depict the results for individuals who experienced low early life stress, and the panels in the right column depict the results for individuals who experienced high early life stress. The panels in the top row depict quadratic effects of time since waking, and the panels in the bottom row depict linear effects. For both early and current life stress, high and low refer to values 1 standard deviation above and below the sample mean, respectively.
Young et al. (2020), Figure 2
Life stress and cortisol reactivity: An exploratory analysis of stress exposure across life on HPA axis functioning.
 ggplot2
- Caption
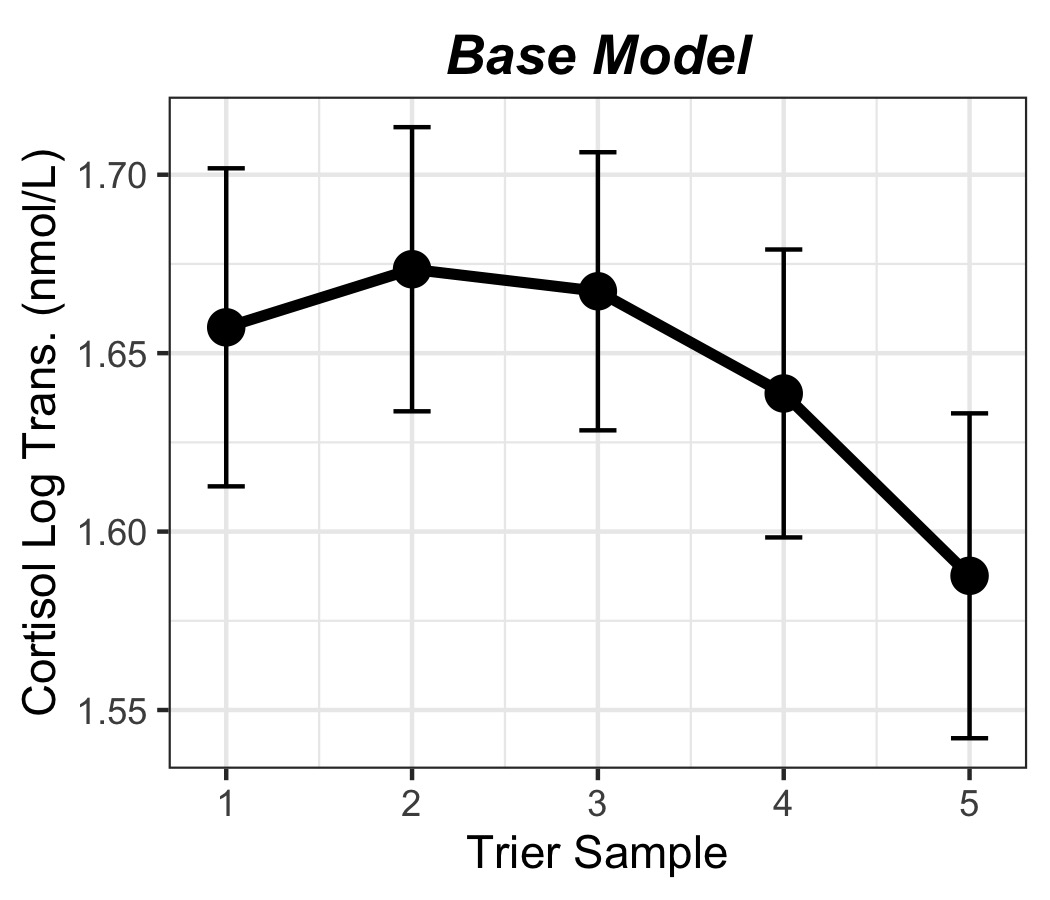
Figure 2. Visualization of the effect of the Trier sample on cortisol reactivity.
Young et al. (2020), Figure 4
Life stress and cortisol reactivity: An exploratory analysis of stress exposure across life on HPA axis functioning.
 ggplot2
- Caption
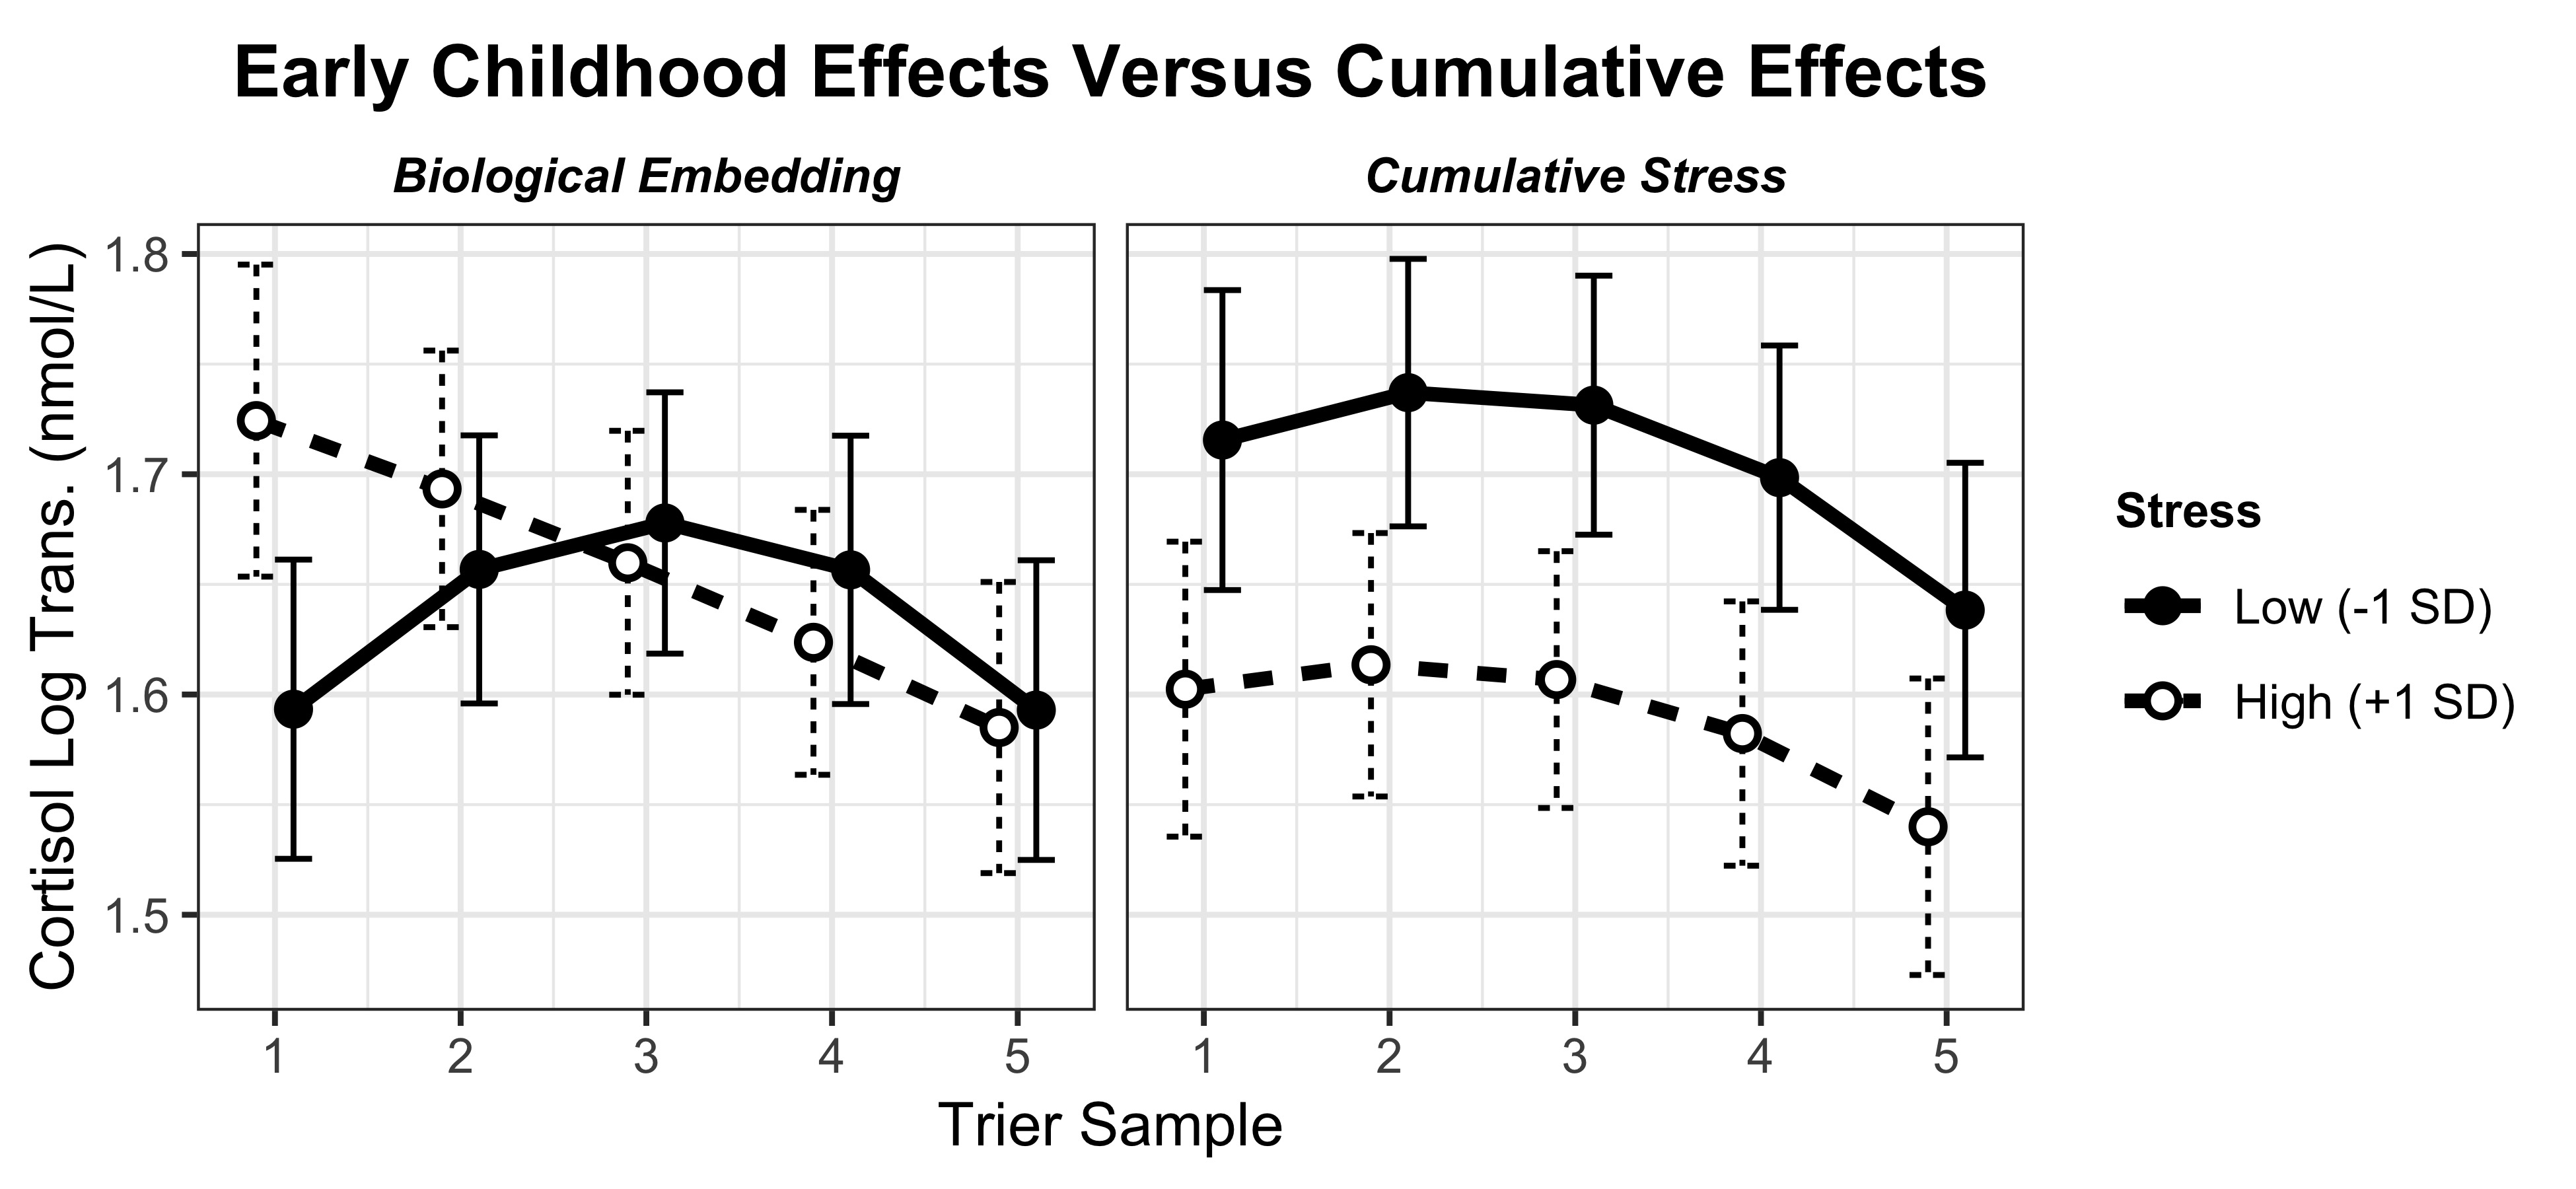
Figure 4. Interaction plot comparing the biological embedding and cumulative stress models. The left panel shows the effect of scoring high versus low on early life stress, controlling for the effects of cumulative life stress. The right panel shows the effect of scoring high versus low on cumulative life stress, controlling for the effects of early life stress. The solid points and lines indicate low life stress (early life stress for the biological embedding model; cumulative for the cumulative stress model), and the open points with dotted lines reflect high life stress.
Frankenhuis et al. (2020), Figure 3
The Hidden Talents Approach: Theoretical and Methodological Challenges
 ggplot2
- Caption
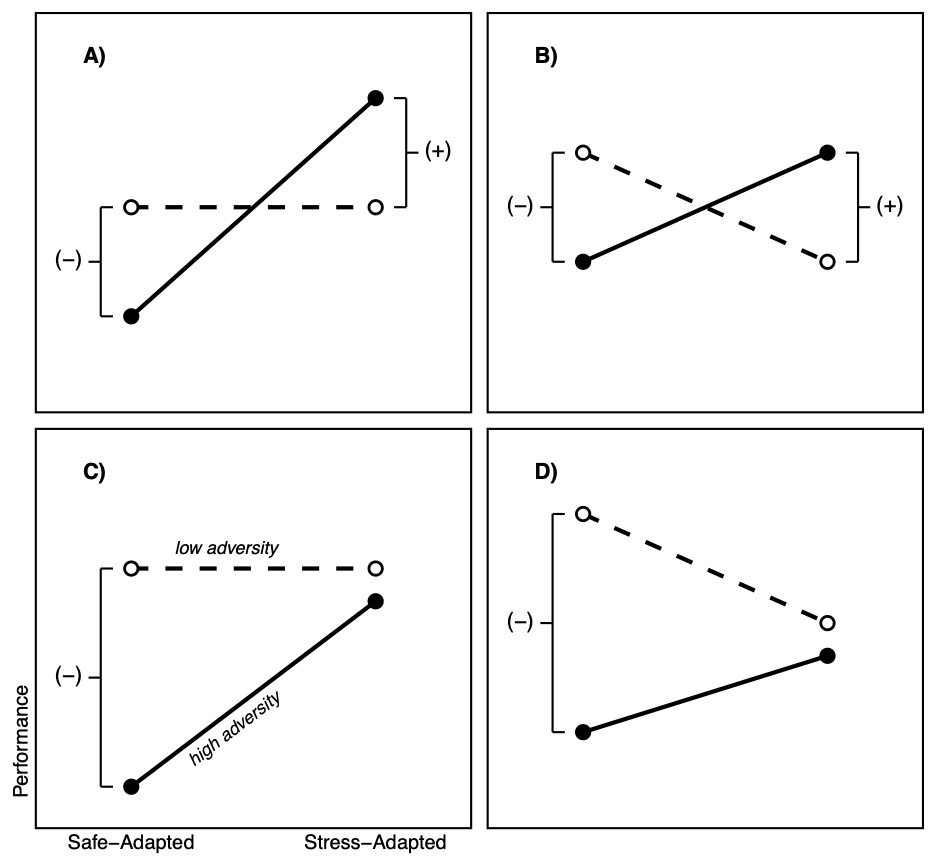
Figure 3. Detecting Hidden Talents in Data. The hidden talents program focuses on abilities that are enhanced through adversity. If an ability is enhanced, people exposed to adversity may perform better on a task measuring this ability compared with people who have not had such exposures. However, this is not always the case. It depends on how impairment and adaptation processes jointly affect performance. Four potential interaction patterns are depicted in (A–D). (A) and (B) show that people who have been exposed to adversity perform better on stress-adapted abilities, both within and across individuals. By contrast, (C) and (D) depict a within-person effect, only. In this scenario, had we only measured stress- adapted abilities, without comparing them with safe-adapted abilities, we would have concluded impairment only and missed signatures of adaptation that emerge in the within-person comparison. For a complete picture, we need to compare not only performance across individuals, but also different abilities within the same person.
Young et al. (2020), Figure 1
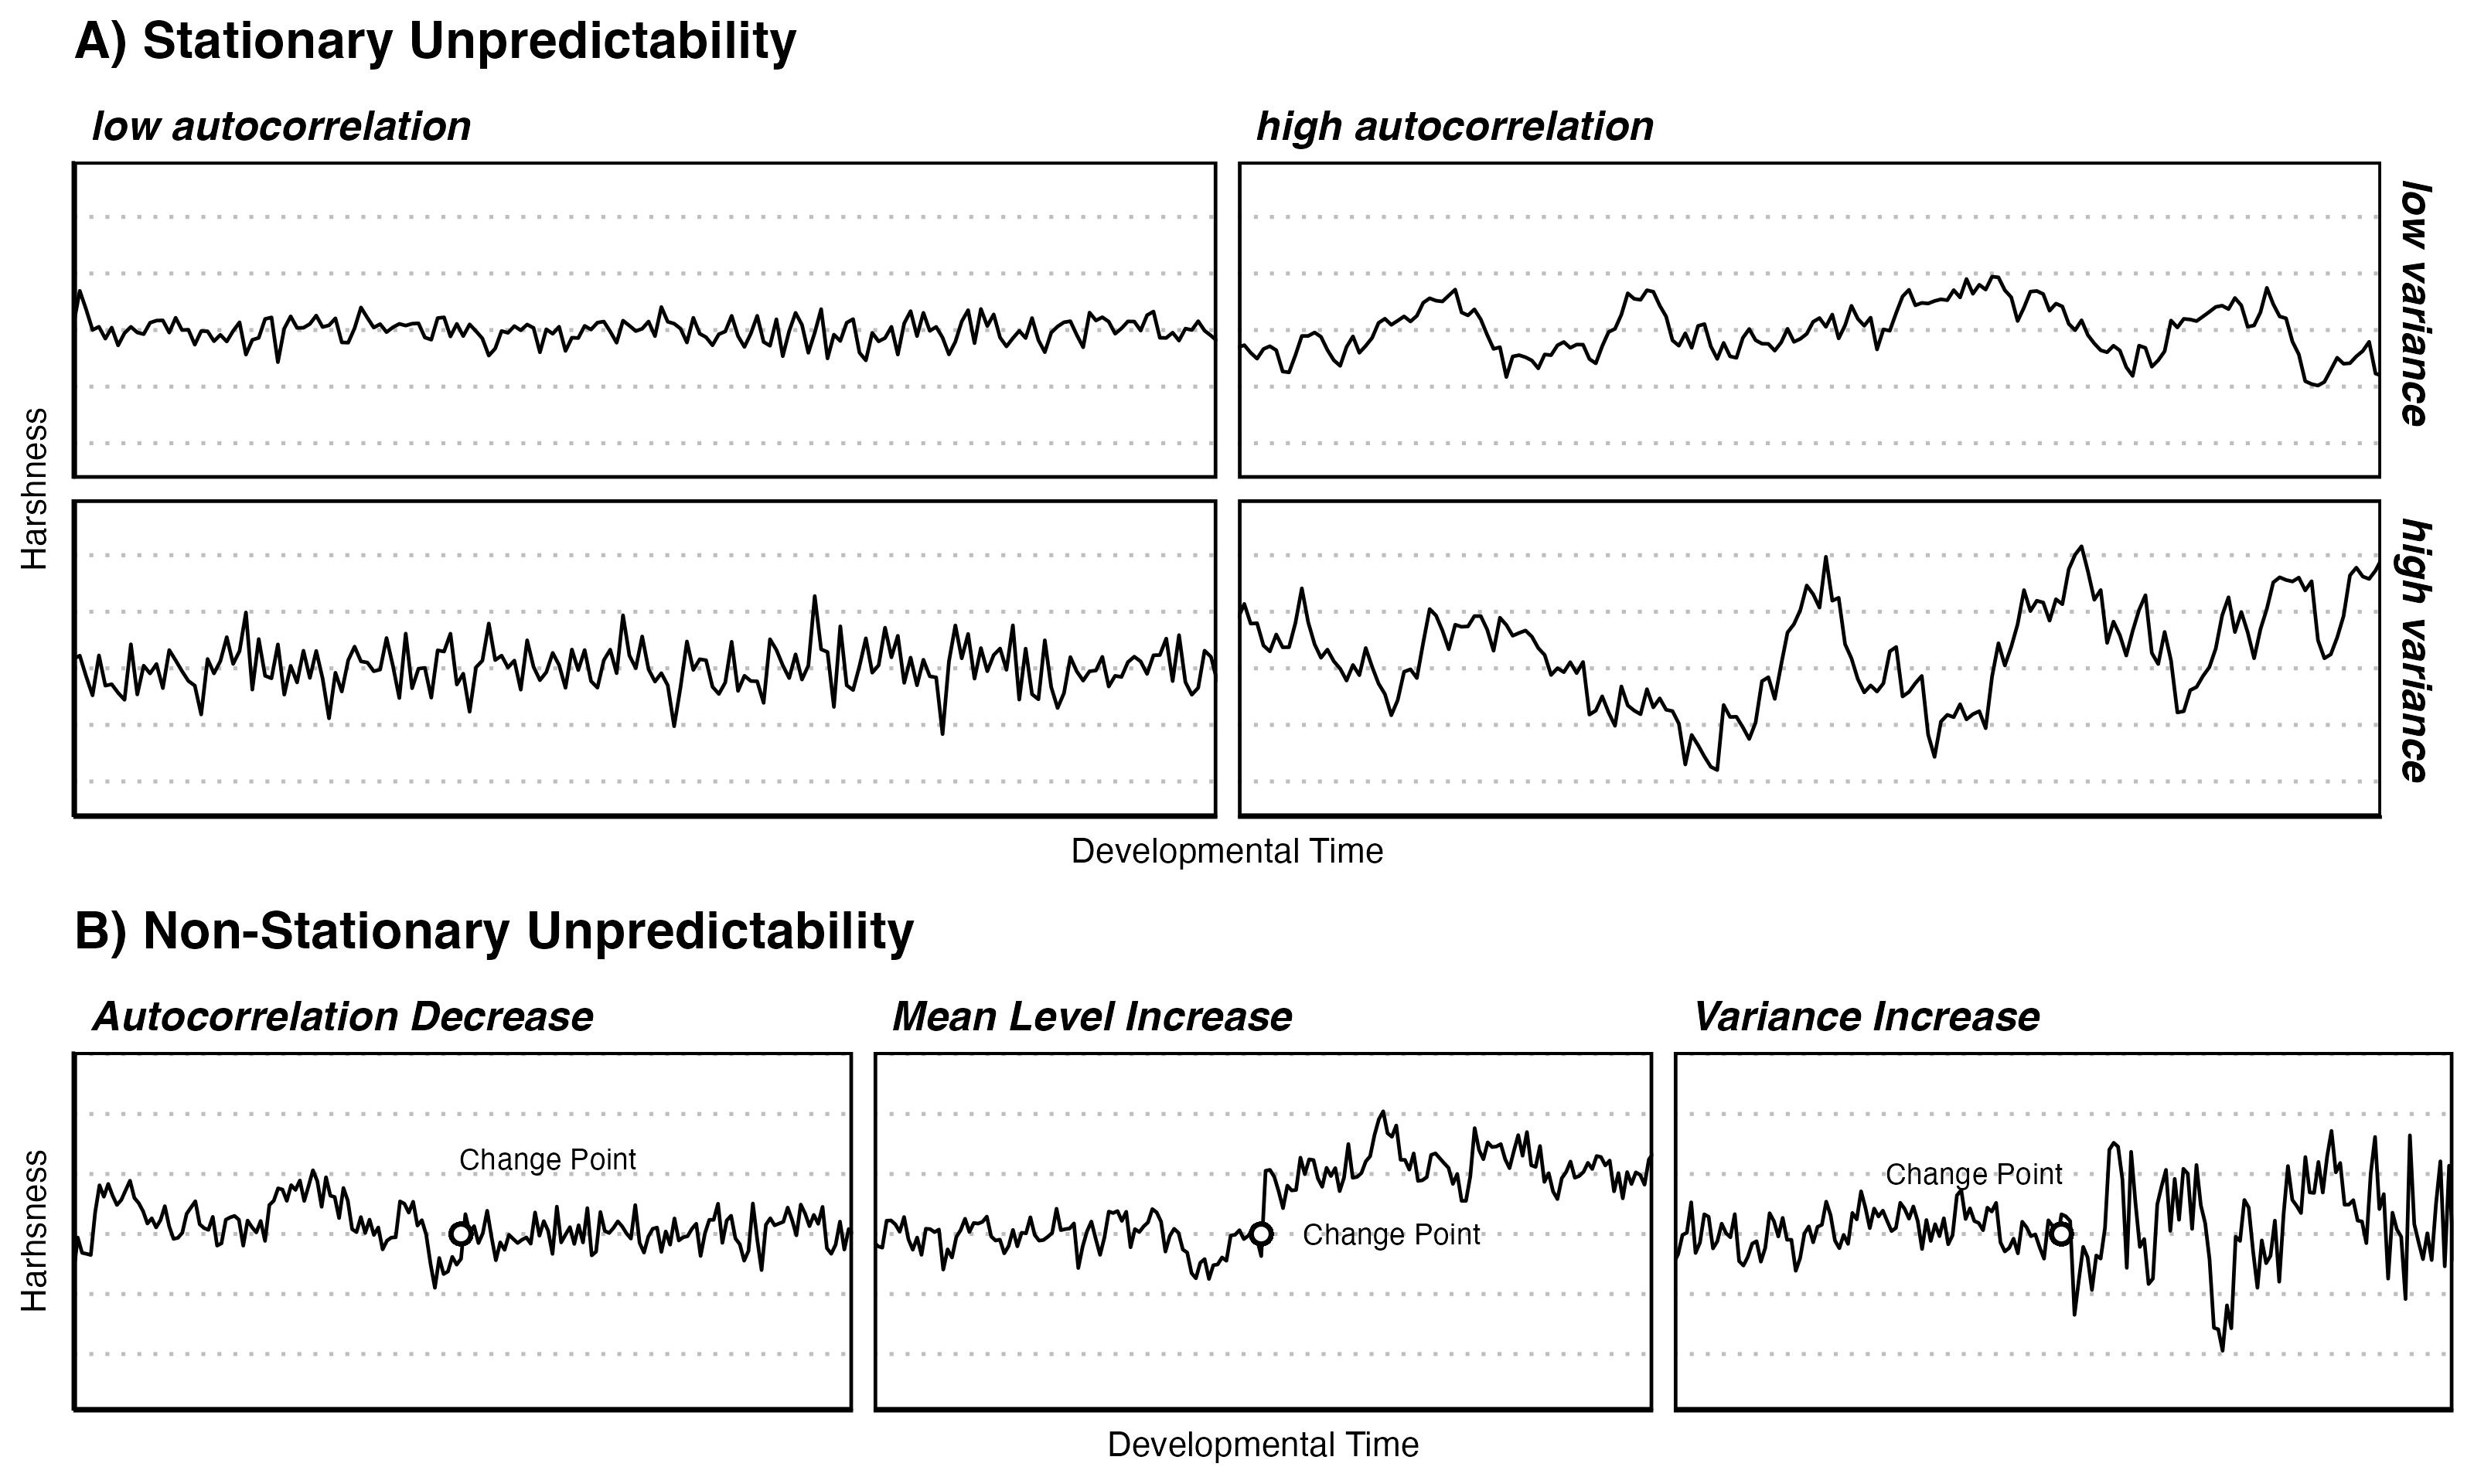
Theory and measurement of environmental unpredictability
 ggplot2
- Caption
Fig. 1. Visual depiction of stationary and non-stationary environmental unpredictability. The x-axis depicts developmental time; the y-axis environmental harshness. A) Ignoring cue reliability, the predictability of a stationary distribution depends on its variance and autocorrelation. When variance is high, harshness fluctuates more than when variance is low. When autocorrelation is high, harshness in one time period is more related to harshness in future time periods. Even if variance is high, fluctuations might still be predictable, if autocorrelation is high. On the flip side, if autocorrelation is low, fluctuations might deviate only little from the mean, if the variance is low. An environment is the most unpredictable when autocorrelation is low and variance is high. B) Ignoring cue reliability, non-stationary environmental unpredictability may be characterized by random change points. Change points are abrupt shifts in the statistical distribution of the environment. Such shifts may occur in the mean, variance, or autocorrelation, or all of them. The timing of change points may itself be predictable or unpredictable (not depicted).
Young et al. (2019), Figure 1
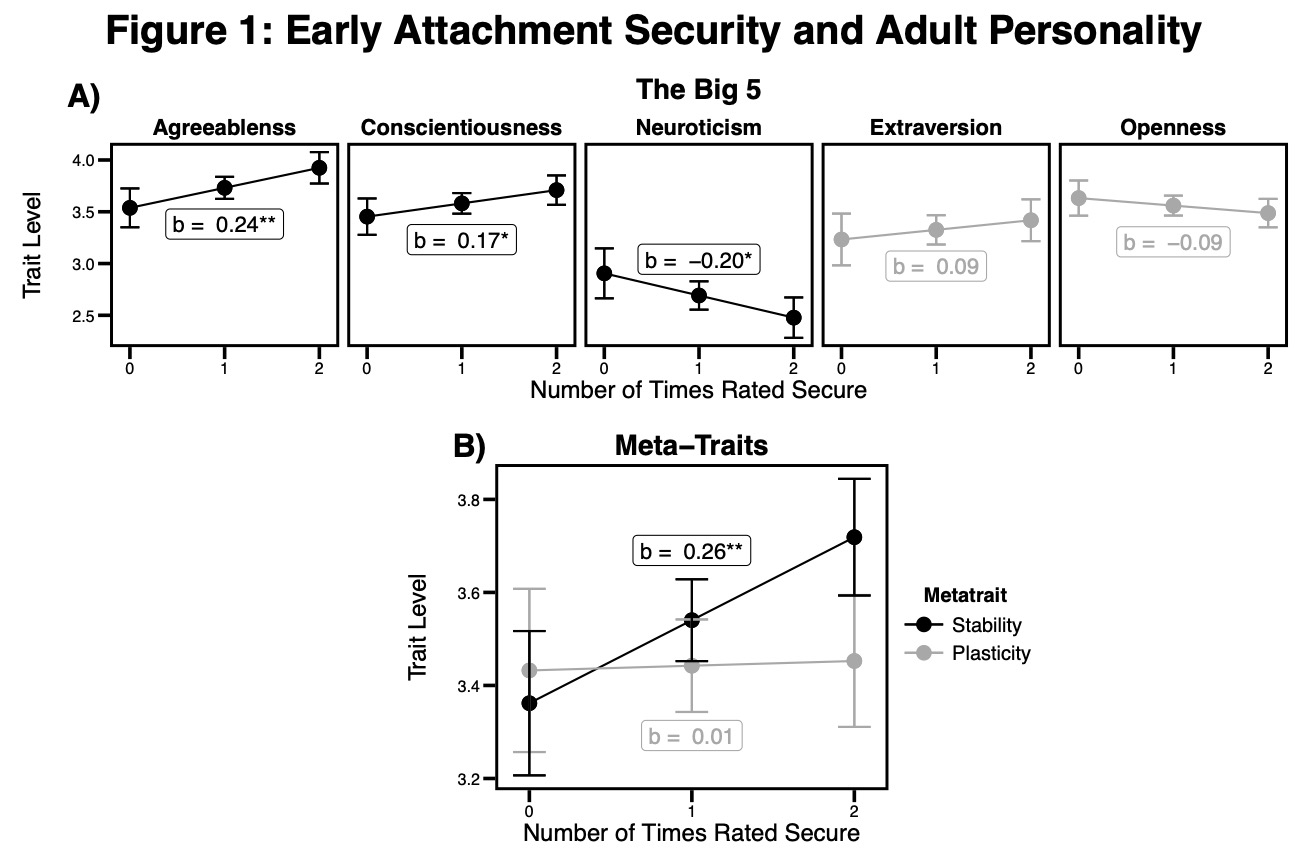
Childhood attachment and adult personality: A life history perspective
 ggplot2
- Caption
Figure 1. early attachment security and adult personality. (a) Predicted Big 5 trait levels for each level of attachment security in childhood. traits that define Stability are plotted in black, whereas traits plotted in gray underlie plasticity. (B) Predicted meta-trait values for each level of attachment security in childhood. notes: for both plots, unstandardized betas reflect the slope of attachment security. all error bars reflect standard errors. **p < .01, *p < .05.
Young et al. (2018), Figure 2
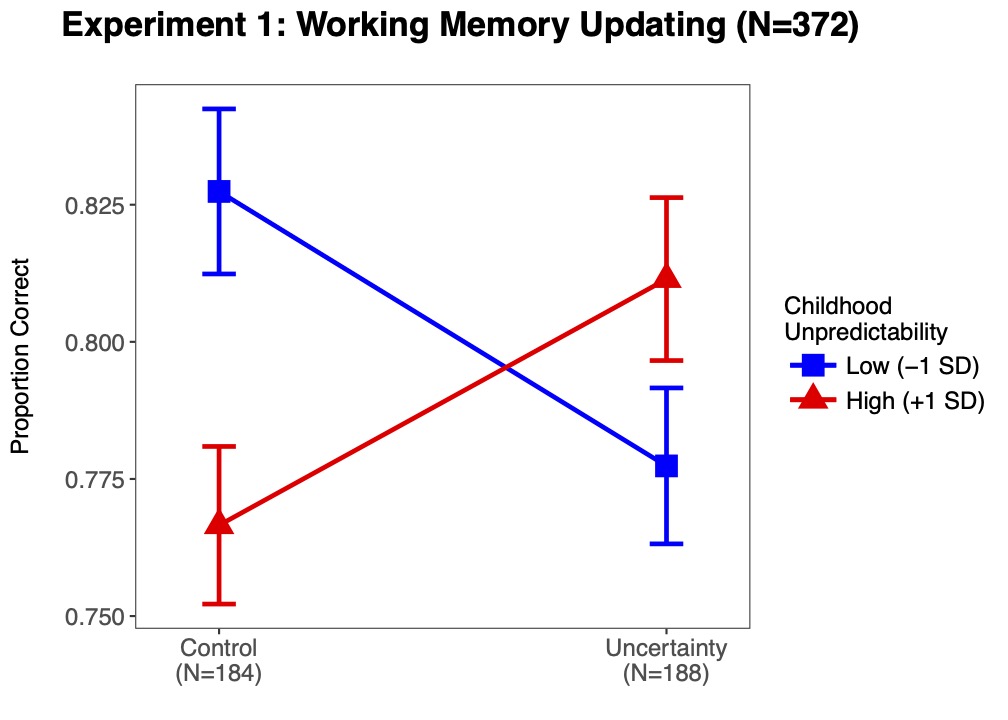
Can an Unpredictable Childhood Environment Enhance Working Memory? Testing the Sensitized-Specialization Hypothesis
 ggplot2
- Caption
Figure 2. Working memory updating (N 372). See the online article for the color version of this figure.
Young et al. (2018), Figure 4
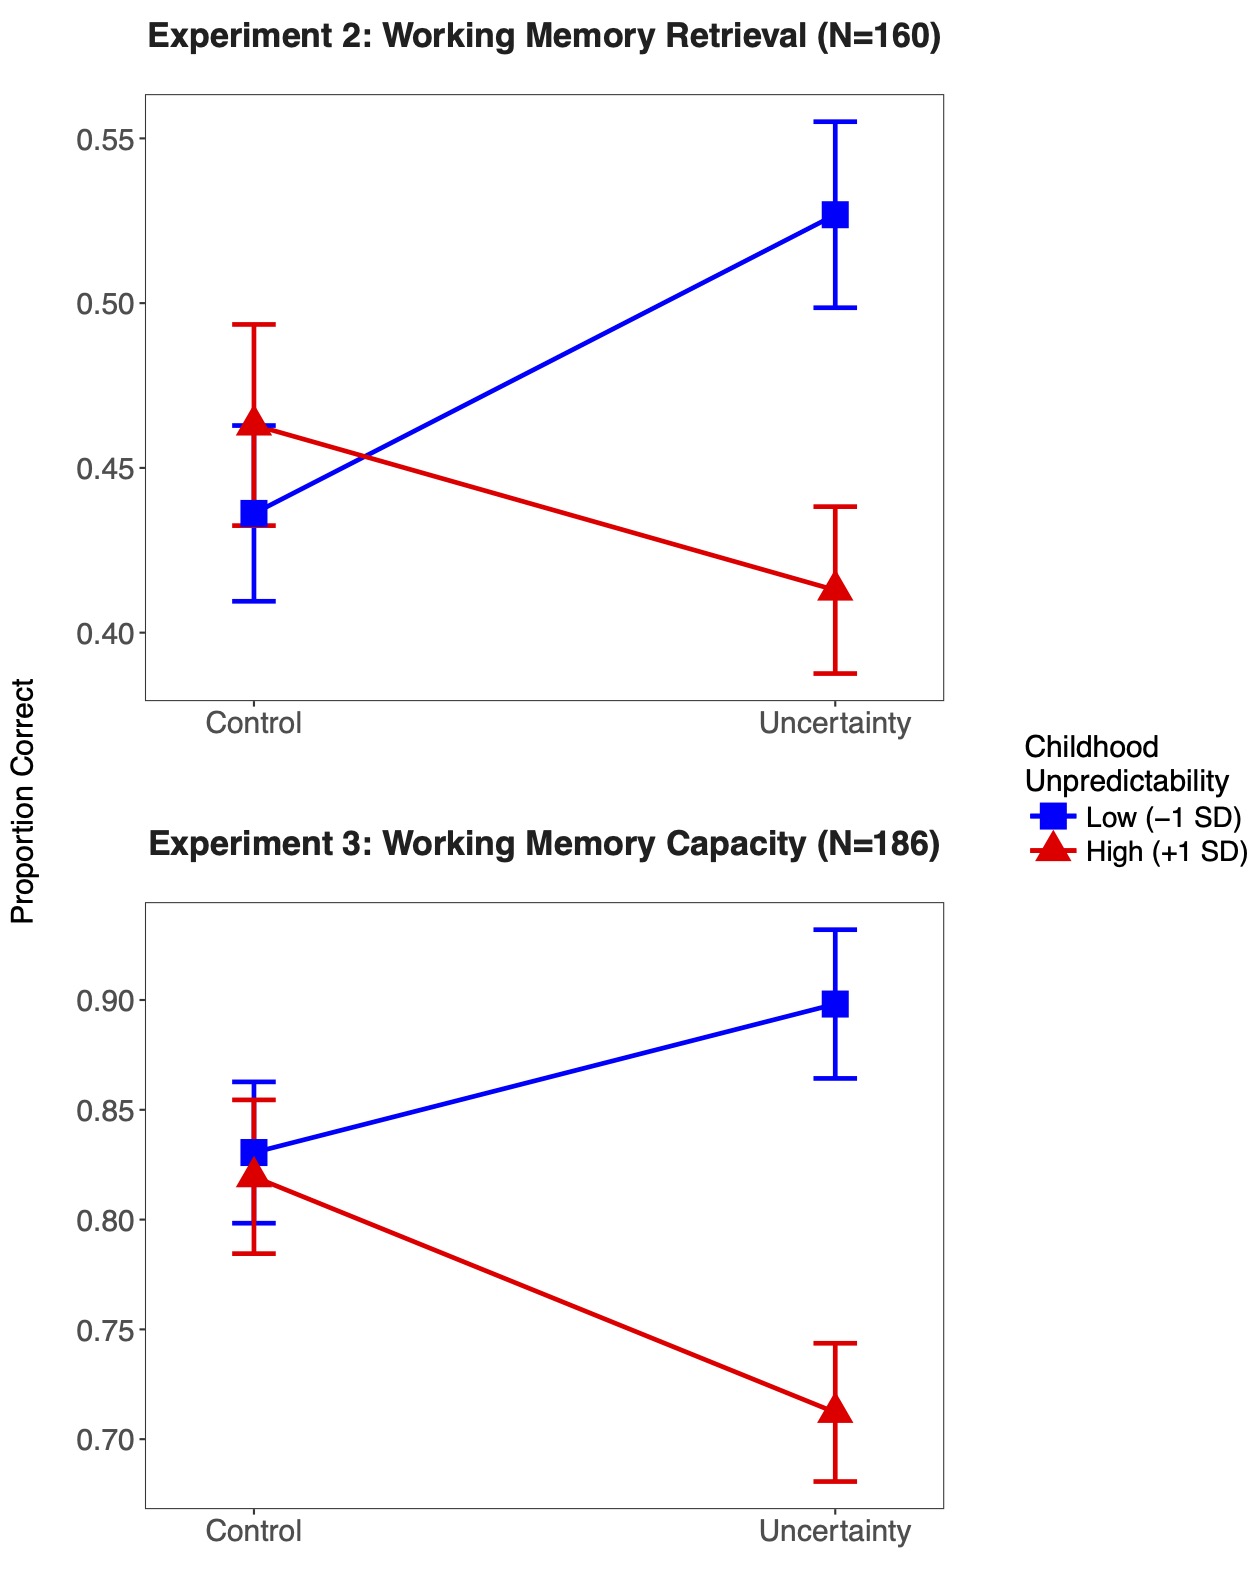
Can an Unpredictable Childhood Environment Enhance Working Memory? Testing the Sensitized-Specialization Hypothesis
 ggplot2
- Caption
Figure 4. Working memory retrieval and capacity. See the online article for the color version of this figure.
Mittal et al. (2015), Figure 3
Cognitive Adaptations to Stressful Environments: When Childhood Adversity Enhances Adult Executive Function
 base R
- Caption
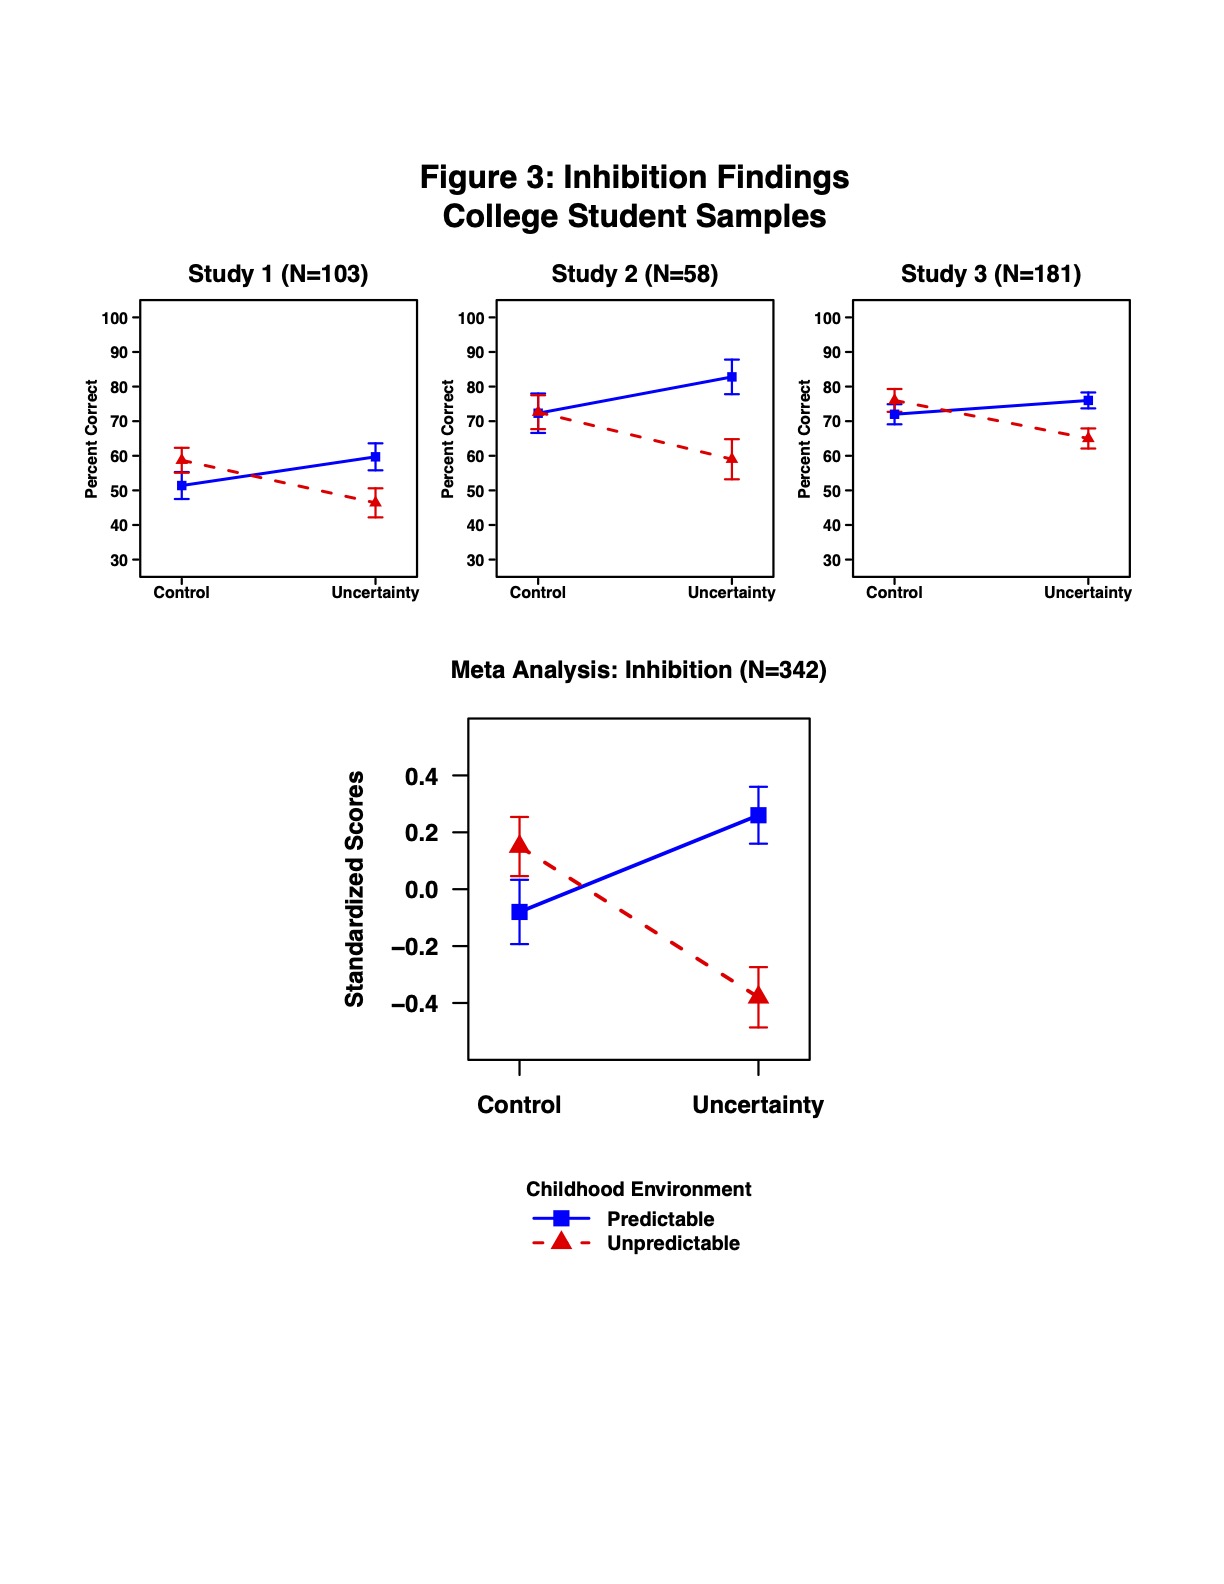
Figure 3. Inhibition findings. College and community samples.
Mittal et al. (2015), Figure 4
Cognitive Adaptations to Stressful Environments: When Childhood Adversity Enhances Adult Executive Function
 base R
- Caption
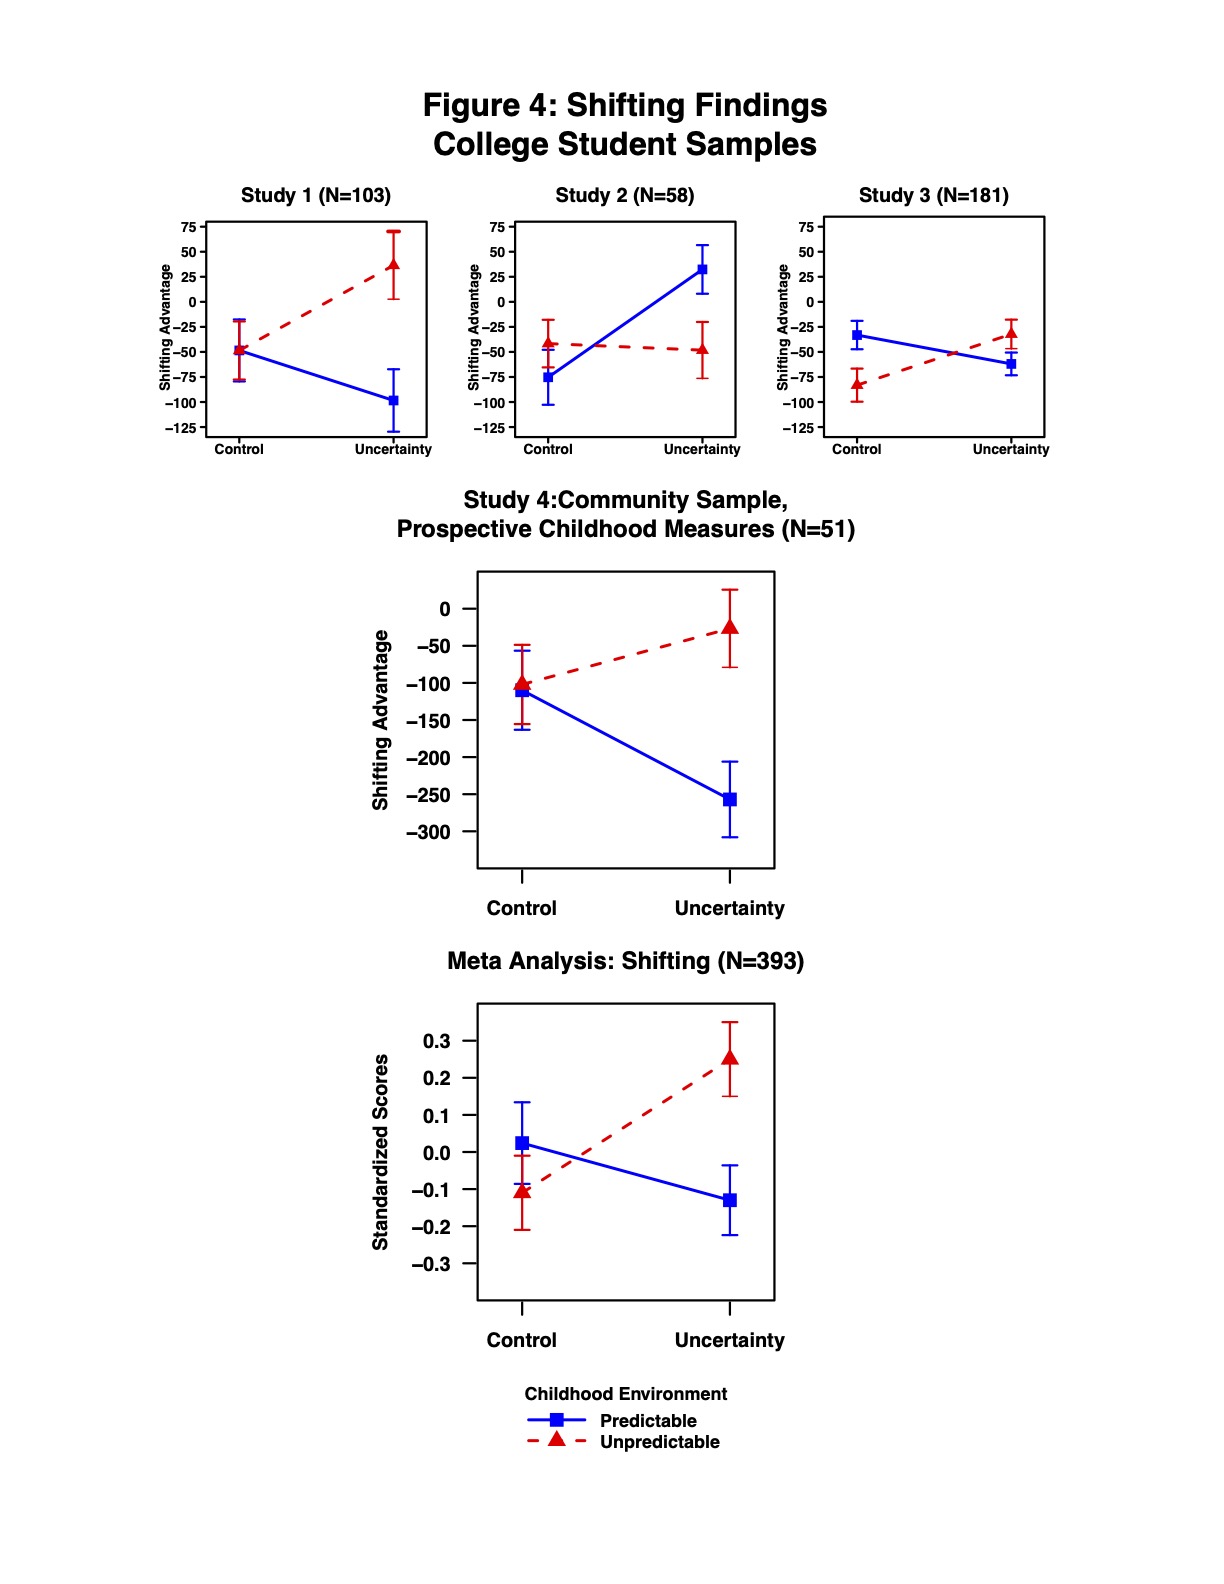
Figure 4. Shifting findings. College and community samples.
Young et al. (2022), Figure 1
Hidden talents in context: Cognitive performance with abstract versus ecological stimuli among adversity-exposed youth.
 powerpoint
- Caption
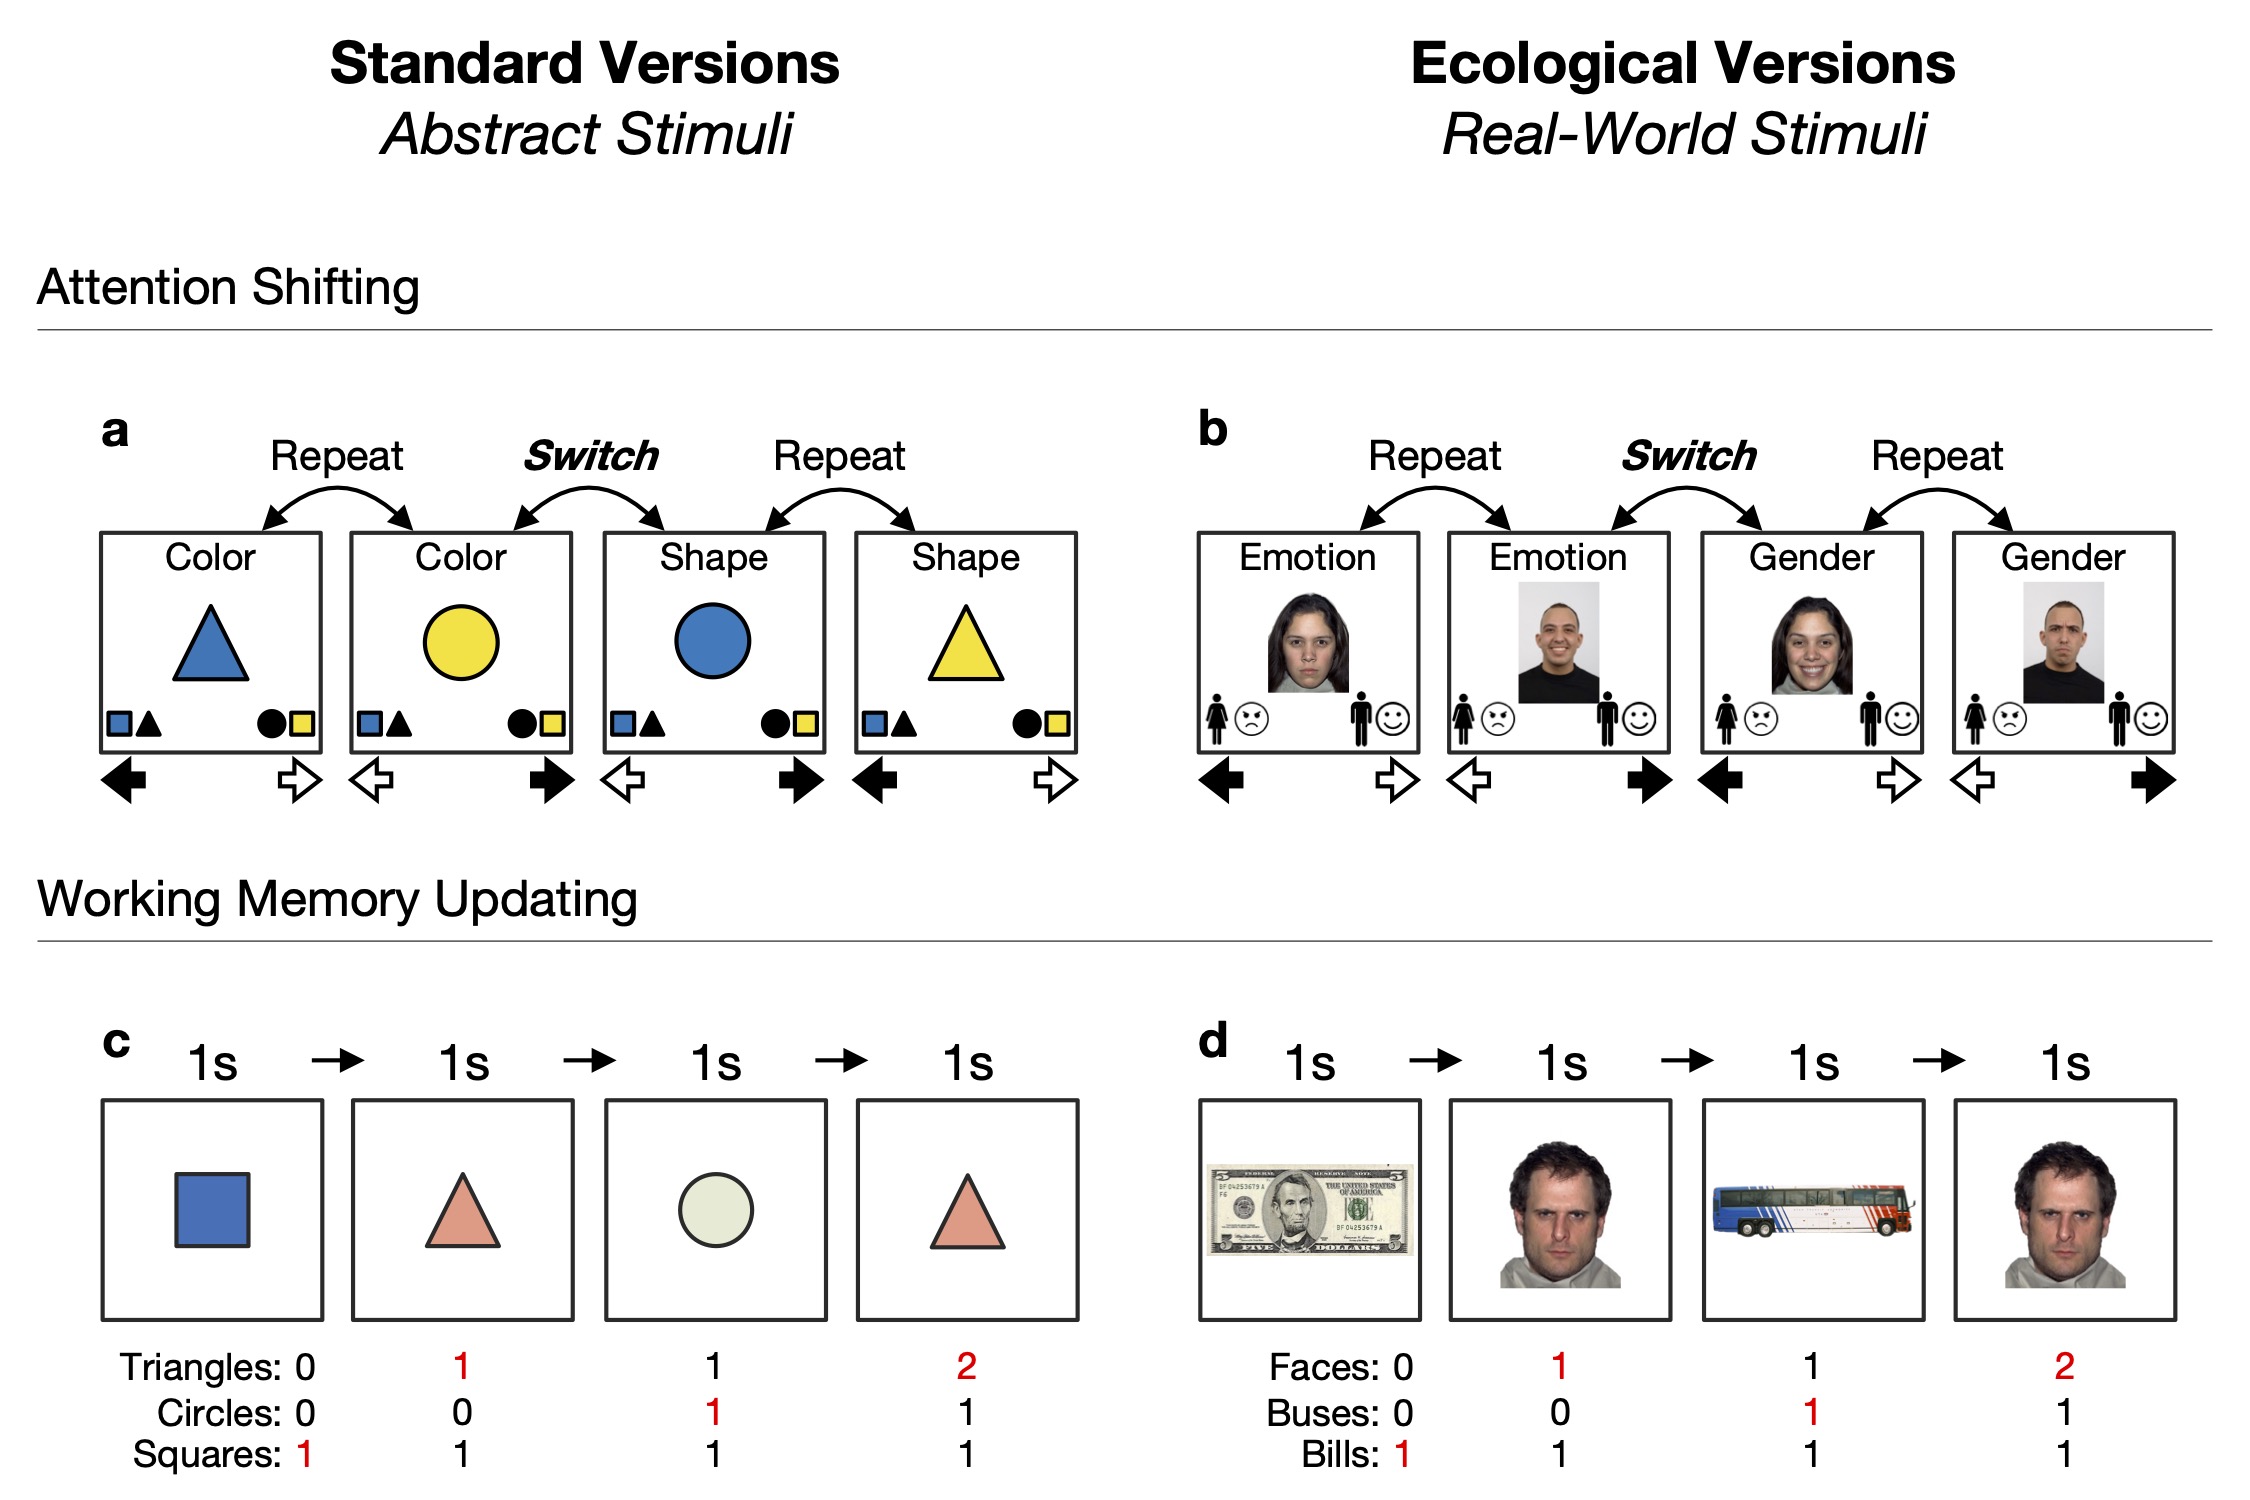
Figure 1. Schematic display of the attention shifting and working memory updating tasks: (a) abstract attention shifting, (b) ecological attention shifting, (c) abstract working memory updating, and (d) ecological working memory updating
Frankenhuis et al. (2020), Figure 1
The Hidden Talents Approach: Theoretical and Methodological Challenges
 draw.io
- Caption
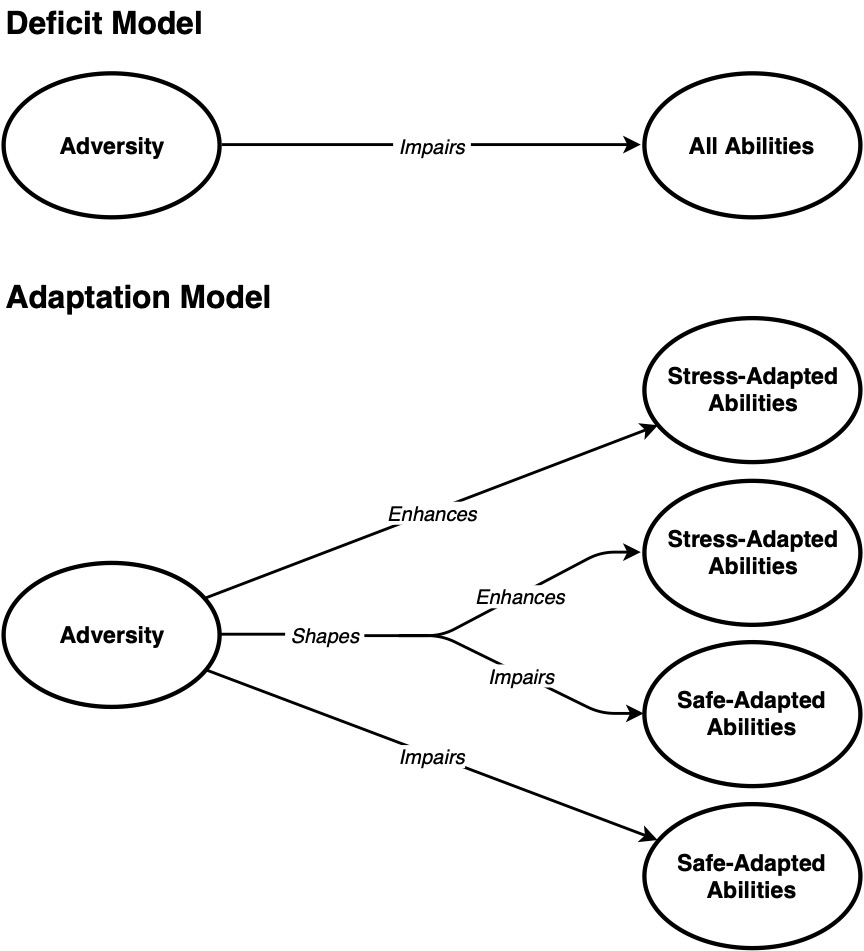
Figure 1. Comparing the Deficit Model with the Adaptation Model. The deficit model focuses on the ways in which adversity impairs the mind. By contrast, the adaptation model assumes that abilities are also shaped by adverse experiences in ways that improve the adaptive fit between individuals and their environments. Exposures to adversity may enhance abilities that are useful in stressful conditions, but impair abilities that are not as useful. Adversity may also shape abilities in different directions; for instance, enhance one ability while impairing another, especially if these abilities trade off with each other. The adaptation model is mutually compatible with the deficit model and suggests new directions for future research. For example, adversity might enhance sets of related but distinct abilities (e.g., attention shifting, working memory updating, vigilance, etc.) and impair others, within the same person. Thus, future research could examine the extent to which there are sets of correlated hidden talents and corresponding sets of impairments.
Frankenhuis et al. (2020), Figure 2
The Hidden Talents Approach: Theoretical and Methodological Challenges
 draw.io
- Caption
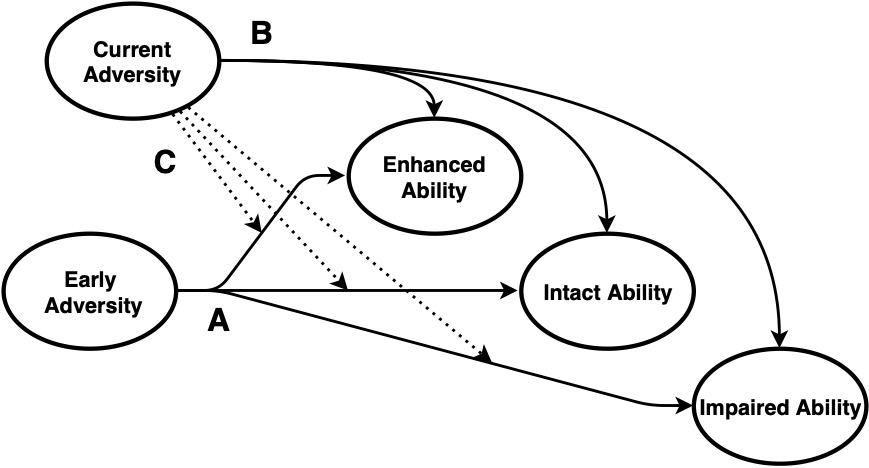
Figure 2. How Exposure to Adversity Might Shape a Specific Ability. There are at least three distinct ways of thinking about how adversity shapes the development of abilities. (A) Early adversity shapes the development of abilities, resulting in enhanced, intact, or impaired performance; (B) current adversity exposure affects abilities, irrespective of developmental exposures; or (C) the interaction between early and current adversity affects performance.
Young et al. (2020), Figure 1
Life stress and cortisol reactivity: An exploratory analysis of stress exposure across life on HPA axis functioning.
 draw.io
- Caption
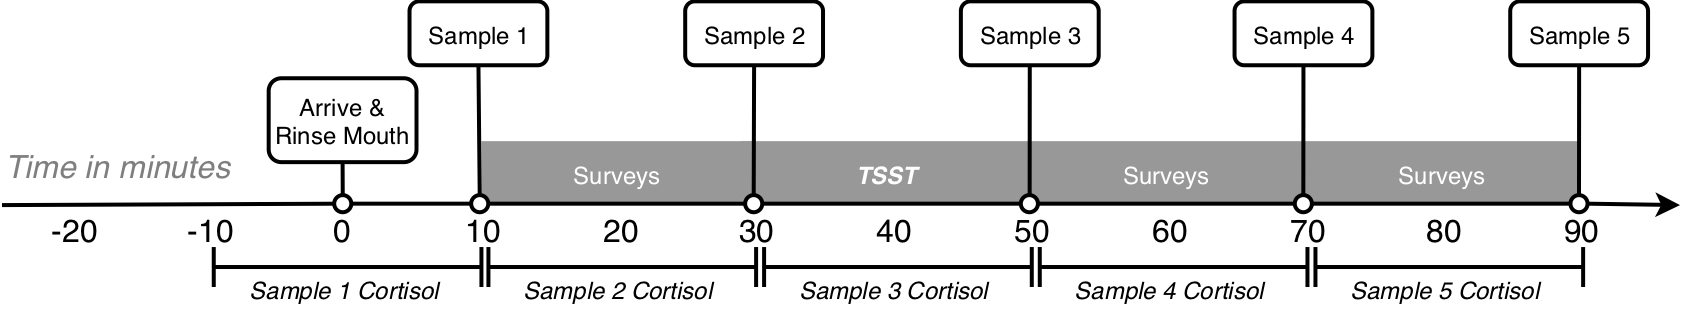
Figure 1. Visual depiction of the session timeline
Young et al. (2020), Figure 2
Theory and measurement of environmental unpredictability
 draw.io
- Caption
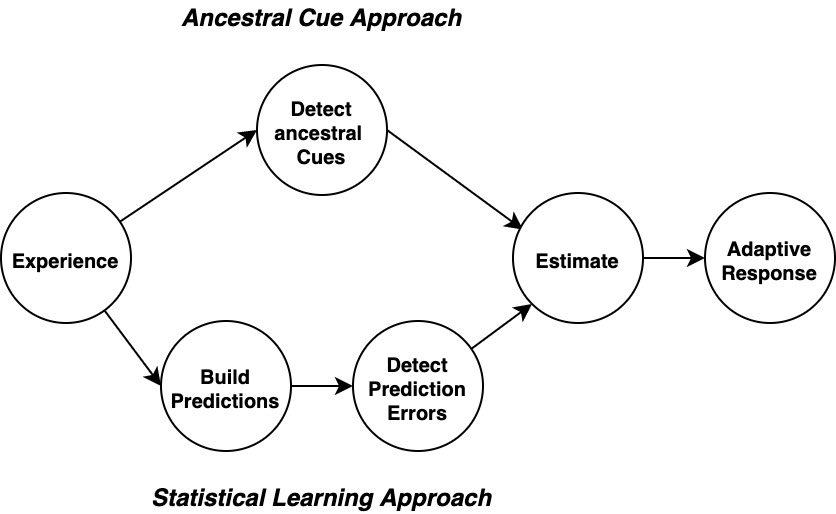
Fig. 2. The ancestral cue and statistical learning approaches. According to the an- cestral cue approach, proximate mechan- isms detect cues that carry ancestral in- formation about environmental unpredictability. If an ancestral cue is de- tected, the organism ‘estimates’ environ- mental unpredictability is high and triggers an adaptive response. According to the statistical learning approach, proximate mechanisms use experience to develop predictions that guide behavior (not ne- cessarily consciously or explicitly). Organisms compare their experience-based predictions to new experiences to evaluate ‘model fit’. If model fit is poor, the or- ganism detects a prediction error, ‘esti- mates' environmental unpredictability is high, and triggers an adaptive response. Note that the two approaches are not mu- tually exclusive. We depict them separately to highlight their differences, however, it is possible that organisms integrate across both sources of information to estimate unpredictability (see Section 5).
Young et al. (2018), Figure 1
Can an Unpredictable Childhood Environment Enhance Working Memory? Testing the Sensitized-Specialization Hypothesis
 powerpoint
- Caption
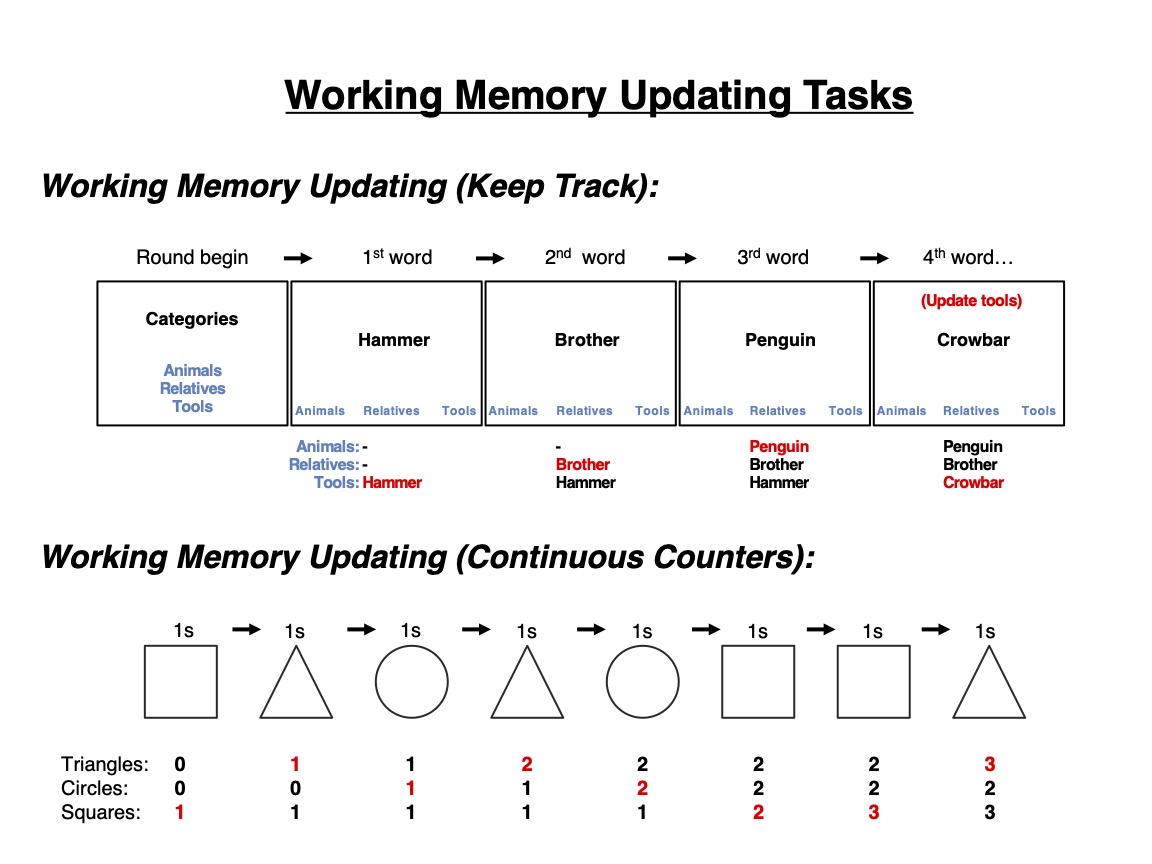
Figure 1. Working memory updating tasks. See the online article for the color version of this figure.
Young et al. (2018), Figure 3
Can an Unpredictable Childhood Environment Enhance Working Memory? Testing the Sensitized-Specialization Hypothesis
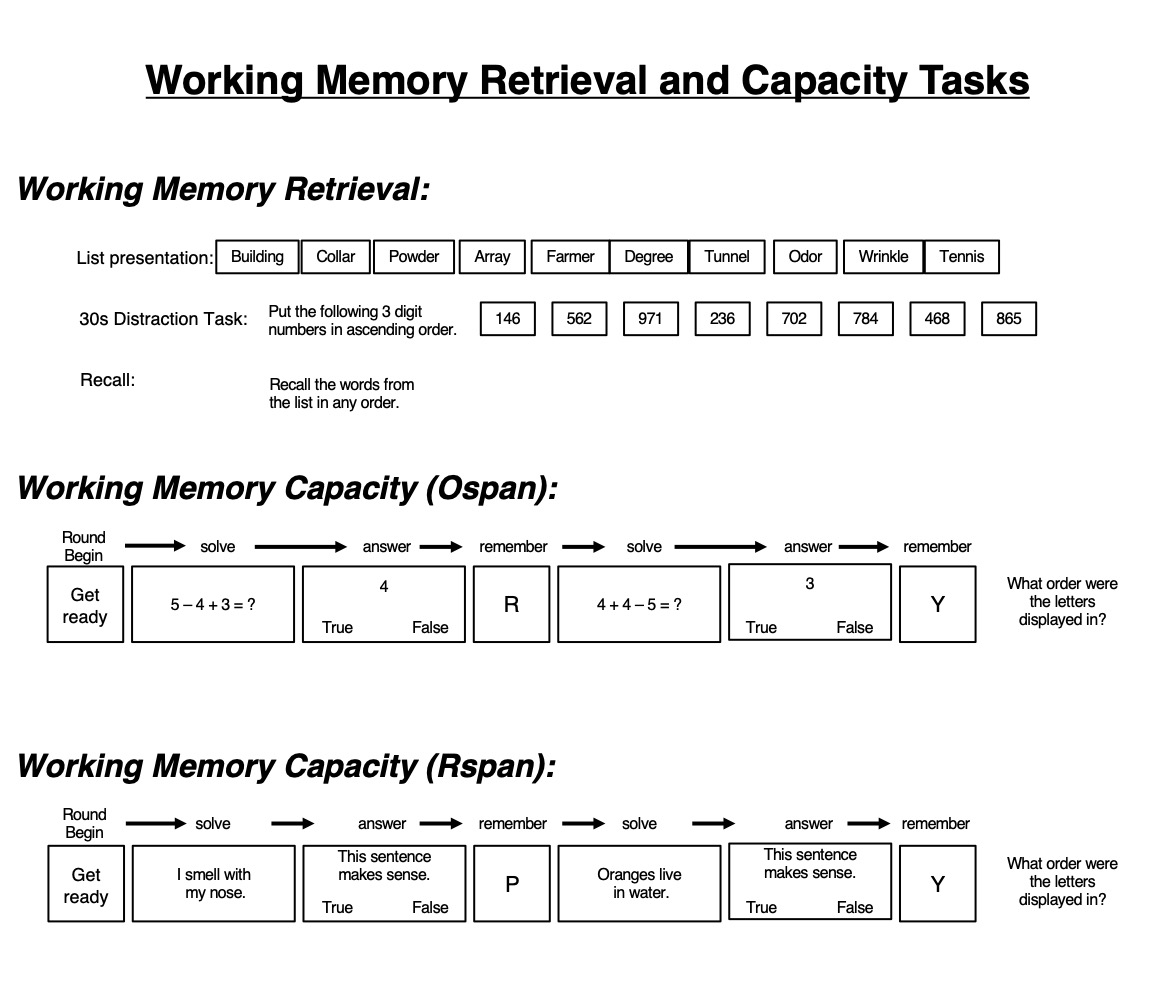 powerpoint
- Caption
Figure 3. Other working memory tasks.
- Caption